问题导读:
1. 如何通过Tensorflow实现线性回归?
2. 如何下载和使用MNIST数据集?
3. 如何使用Tensorflow实现分类算法?
4. 如何使用Tensorflow实现最近邻算法?
5. 如何使用Tensorflow实现聚类算法?

上一篇:TensorFlow教程:2使用TensorFlow实现数学计算
在本章中,我们将介绍以下主题:
- 线性回归
- MNIST数据集
- 分类
- 最近邻算法
- 数据聚类
- k-means算法
The linear regression algorithm
在这一节中,我们用线性回归算法开始我们对机器学习技术的探索。 我们的目标是建立一个模型,从一个或多个独立变量的值预测因变量的值。 这两个变量之间的关系是线性的;也就是说,如果y是因变量而x是独立的,那么两个变量之间的线性关系将如下所示:y = Ax + b 。 线性回归算法适应各种各样的情况;由于其多功能性,它广泛用于应用科学领域,例如生物学和经济学。
Furthermore, the implementation of this algorithm allows us to introduce in a totally clear and understandable way the two important concepts of machine learning: the cost function and the gradient descent algorithms.
Data model
第一个关键的步骤是建立我们的数据模型。 我们前面提到,我们的变量之间的关系是线性的,即:y = Ax + b,其中A和b是常数。 为了测试我们的算法,我们需要在二维空间中的数据点。
我们从导入Python库NumPy开始: [mw_shl_code=python,true]import numpy as np[/mw_shl_code]然后我们定义要绘制的点的数量: [mw_shl_code=python,true]number_of_points = 500[/mw_shl_code]我们初始化以下两个列表: [mw_shl_code=python,true]x_point = []
y_point = [][/mw_shl_code]这些点将包含生成的点。 然后我们设置两个常量,它们将以y与x的线性关系出现: [mw_shl_code=python,true]a = 0.22
b = 0.78[/mw_shl_code]Via NumPy's random.normal function, we generate 300 random points around the regression equation y = 0.22x + 0.78: [mw_shl_code=python,true]for i in range(number_of_points):
x = np.random.normal(0.0,0.5)
y = a*x + b +np.random.normal(0.0,0.1)
x_point.append([x])
y_point.append([y])[/mw_shl_code]最后,通过matplotlib查看生成的点: [mw_shl_code=python,true]import matplotlib.pyplot as plt
plt.plot(x_point,y_point, 'o', label='Input Data')
plt.legend()
plt.show()[/mw_shl_code]
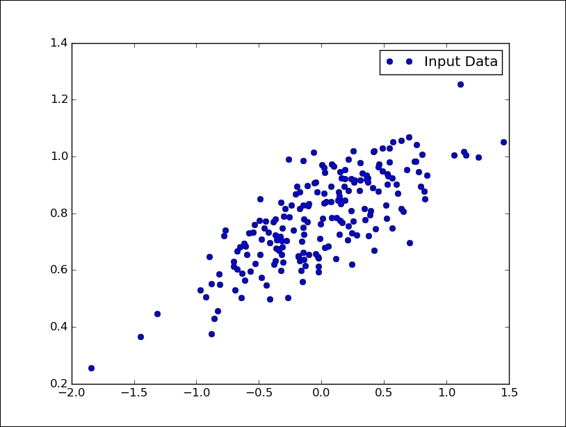
线性回归:数据模型
成本函数和梯度下降
我们想用TensorFlow实现的机器学习算法必须根据我们的数据模型预测y作为x数据的函数。 The linear regression algorithm will determine the values of the constants A and b (fixed for our data model), which are then the true unknowns of the problem. 第一步是导入tensorflow库: [mw_shl_code=python,true]import tensorflow as tf[/mw_shl_code]然后使用TensorFlow tf.Variable定义A和b未知数。 [mw_shl_code=python,true]A = tf.Variable(tf.random_uniform([1], -1.0, 1.0))[/mw_shl_code]The unknown factor A was initialized using a random value between -1 and 1, while the variable b is initially set to zero: [mw_shl_code=python,true]b = tf.Variable(tf.zeros([1]))[/mw_shl_code]所以我们写出将y绑定到x的线性关系: [mw_shl_code=python,true]y = A * x_point + b[/mw_shl_code]Now we will introduce, this cost function: that has parameters containing a pair of values A and b to be determined which returns a value that estimates how well the parameters are correct. 在这个例子中,我们的成本函数是mean square error: [mw_shl_code=python,true]cost_function = tf.reduce_mean(tf.square(y - y_point))[/mw_shl_code]It provides an estimate of the variability of the measures, or more precisely, of the dispersion of values around the average value; a small value of this function corresponds to a best estimate for the unknown parameters A and b.
To minimize cost_function, we use an optimization algorithm with the gradient descent. 给定几个变量的数学函数,梯度下降允许找到这个函数的局部最小值。 技术如下: - Evaluate, at an arbitrary first point of the function's domain, the function itself and its gradient. 梯度表示函数趋于最小的方向。
- Select第二个点。 如果此第二点的函数的值低于第一点计算的值,则可继续下降。
您可以参考下图对该算法的视觉解释:
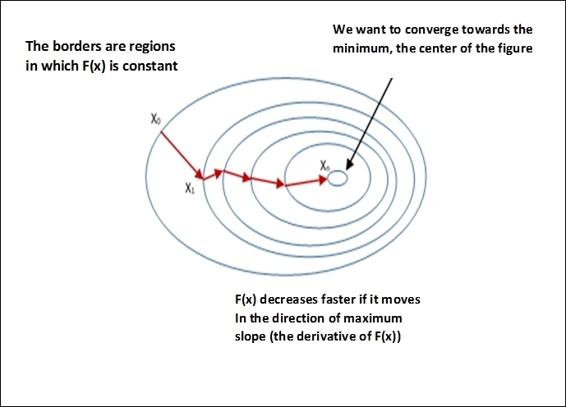
梯度下降算法
We also remark that the gradient descent is only a local function minimum, but it can also be used in the search for a global minimum, randomly choosing a new start point once it has found a local minimum and repeating the process many times. 如果函数的最小值数目是有限的,而且尝试的次数非常多,那么全球最小值迟早会很有可能被识别出来。
使用TensorFlow,这个算法的应用非常简单。 指令如下: [mw_shl_code=python,true]optimizer = tf.train.GradientDescentOptimizer(0.5)[/mw_shl_code]Here 0.5 is the learning rate of the algorithm.
学习率决定了我们朝着最佳权重移动的速度有多快。 如果它非常大,我们跳过最优解,如果它太小,我们需要太多迭代来收敛到最佳值。 An intermediate value (0.5) is provided, but it must be tuned in order to improve the performance of the entire procedure.
我们将train定义为应用cost_function(optimizer)的结果,通过minimize函数: [mw_shl_code=python,true]train = optimizer.minimize(cost_function)[/mw_shl_code]测试模型
现在我们可以在之前创建的数据模型上测试梯度下降的算法。 像往常一样,我们必须初始化所有变量: [mw_shl_code=python,true]model = tf.initialize_all_variables()[/mw_shl_code]所以我们建立迭代(20个计算步骤),使我们能够确定A和b的最佳值,它们定义了最适合数据模型的线。 实例化评估图: [mw_shl_code=python,true]with tf.Session() as session:[/mw_shl_code]我们在我们的模型上进行模拟: [mw_shl_code=python,true] session.run(model)
for step in range(0,21):[/mw_shl_code]对于每个迭代,我们执行优化步骤: [mw_shl_code=python,true]session.run(train)[/mw_shl_code]每五步,我们就会打印我们的点阵图案: [mw_shl_code=python,true] if (step % 5) == 0:
plt.plot(x_point,y_point,'o',
label='step = {}'
.format(step))[/mw_shl_code]直线是通过以下命令获得的: [mw_shl_code=python,true] plt.plot(x_point,
session.run(A) *
x_point +
session.run(B))
plt.legend()
plt.show()[/mw_shl_code]下图显示了实现的算法的收敛性:
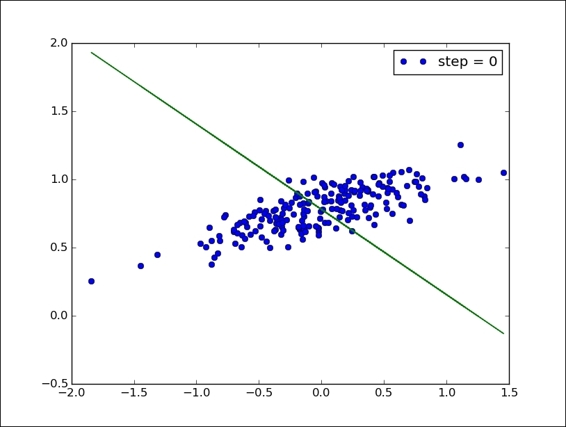
线性回归:开始计算(步骤= 0)
经过五步之后,我们已经可以看到(在下图中)线条的合适性有了显着的提高:
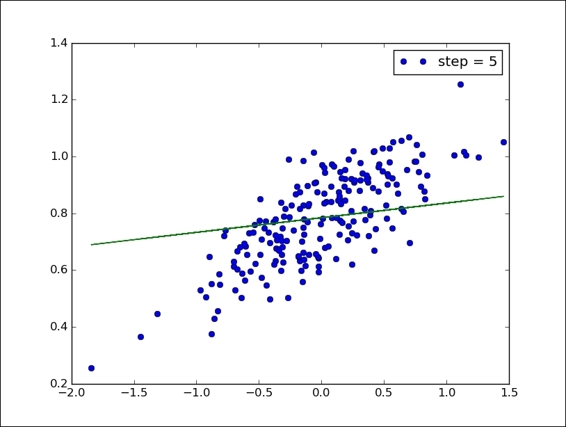
线性回归:5个计算步骤后的情况
以下(和最终)图显示了20步之后的确定结果。 我们可以看到所使用的算法的效率,在整个云点上直线效率是完美的。
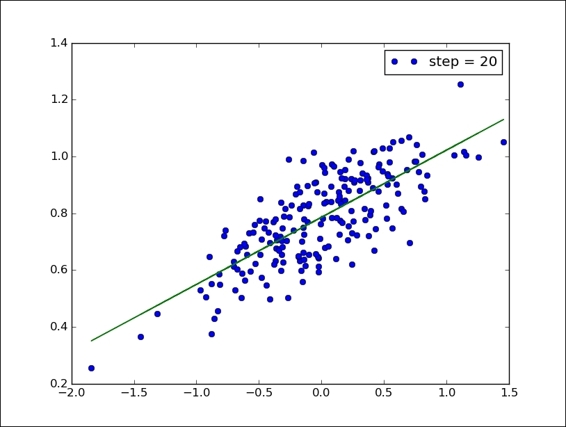
线性回归:最终结果
最后,为了进一步理解,我们报告完整的代码: [mw_shl_code=python,true]import numpy as np
import matplotlib.pyplot as plt
import tensorflow as tf
number_of_points = 200
x_point = []
y_point = []
a = 0.22
b = 0.78
for i in range(number_of_points):
x = np.random.normal(0.0,0.5)
y = a*x + b +np.random.normal(0.0,0.1)
x_point.append([x])
y_point.append([y])
plt.plot(x_point,y_point, 'o', label='Input Data')
plt.legend()
plt.show()
A = tf.Variable(tf.random_uniform([1], -1.0, 1.0))
B = tf.Variable(tf.zeros([1]))
y = A * x_point + B
cost_function = tf.reduce_mean(tf.square(y - y_point))
optimizer = tf.train.GradientDescentOptimizer(0.5)
train = optimizer.minimize(cost_function)
model = tf.initialize_all_variables()
with tf.Session() as session:
session.run(model)
for step in range(0,21):
session.run(train)
if (step % 5) == 0:
plt.plot(x_point,y_point,'o',
label='step = {}'
.format(step))
plt.plot(x_point,
session.run(A) *
x_point +
session.run(B))
plt.legend()
plt.show()[/mw_shl_code]
The MNIST dataset
The MNIST dataset (available at http://yann.lecun.com/exdb/mnist/), is widely used for training and testing in the field of machine learning, and we will use it in the examples of this book. 它包含从0到9的手写数字的黑白图像。
数据集分为两组:60000个训练模型和另外10000个测试。 将原始的黑白图像归一化为适合28×28像素大小的盒子,并通过计算像素的质心来进行中心对准。 下图表示数字如何在MNIST数据集中表示:
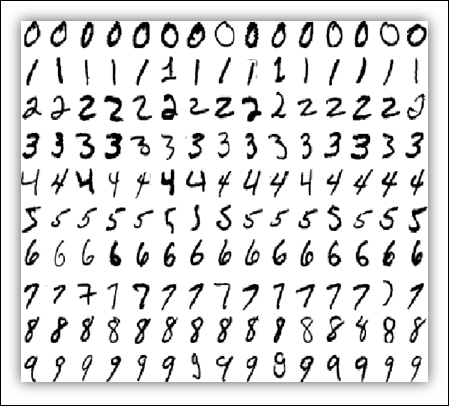
MNIST数字采样
每个MNIST数据点是描述每个像素有多暗的数字的数组。 例如,对于下面的数字(数字1),我们可以有:
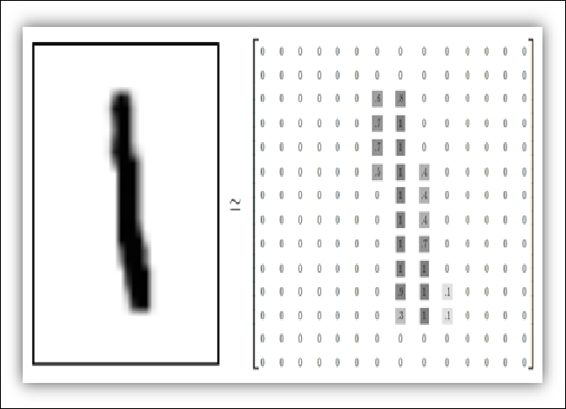
数字1的像素表示
Downloading and preparing the data
下面的代码导入我们要分类的MNIST数据文件。 我正在使用Google的脚本,可以从以下地址下载: https://github.com/tensorflow/tensorflow/blob/r0.7/tensorflow/examples/tutorials/mnist/input_data.py T0>。 这必须在文件所在的同一个文件夹中运行。 现在我们将展示如何加载和显示数据: [mw_shl_code=python,true]import input_data
import numpy as np
import matplotlib.pyplot as plt[/mw_shl_code]使用input_data,我们加载数据集: [mw_shl_code=python,true]mnist_images = input_data.read_data_sets\
("MNIST_data/",\
one_hot=False)
train.next_batch(10) returns the first 10 images :
pixels,real_values = mnist_images.train.next_batch(10)[/mw_shl_code]这也返回两个列表:加载的像素的矩阵和包含加载的实际值的列表: [mw_shl_code=python,true]print "list of values loaded ",real_values
example_to_visualize = 5
print "element N° " + str(example_to_visualize + 1)\
+ " of the list plotted"
>>
Extracting MNIST_data/train-labels-idx1-ubyte.gz
Extracting MNIST_data/t10k-images-idx3-ubyte.gz
Extracting MNIST_data/t10k-labels-idx1-ubyte.gz
list of values loaded [7 3 4 6 1 8 1 0 9 8]
element N 6 of the list plotted
>>[/mw_shl_code]在显示元素时,我们可以使用matplotlib,如下所示: [mw_shl_code=python,true]image = pixels[example_to_visualize,:]
image = np.reshape(image,[28,28])
plt.imshow(image)
plt.show()[/mw_shl_code]结果如下:
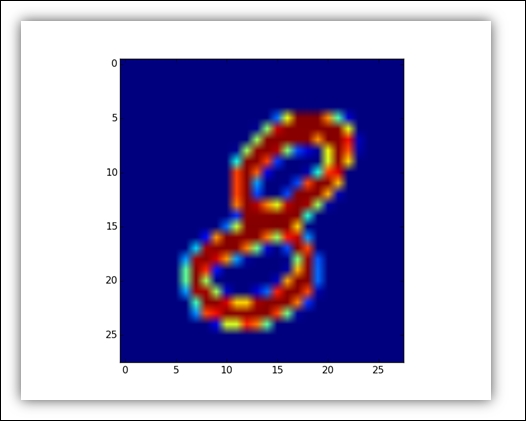
数字8的MNIST图像
Classifiers
在机器学习的情况下,术语classification标识将每个新输入数据(instance)分配给可能类别之一(classes 如果我们只考虑两个类,我们讨论二进制分类;否则我们有一个多级分类。
The classification falls into the supervised learning category, which permits us to classify new instances based on the so-called training set. 解决监督分类问题的基本步骤如下: - 构建培训示例,以表示实现分类的实际环境和应用。
- 选择分类器和相应的算法实现。
- 在训练集上训练算法,并通过验证设置任何控制参数。
- 通过应用一组新的实例(测试集)来评估分类器的准确性和性能。
The nearest neighbor algorithm
The K-nearest neighbor (KNN) is a supervised learning algorithm for both classification or regression. 这是一个系统,根据存储在内存中的对象的距离来分配被测样本的类别。
The distance, d, is defined as the Euclidean distance between two points:

这里n是空间的尺寸。 这种分类方法的优点是能够对类别are not linearly separable。 It is a stable classifier, given that small perturbations of the training data do not significantly affectthe results obtained. 然而最明显的缺点是它没有提供一个真正的数学模型;相反,对于每个新的分类,都应该通过将新数据添加到所有初始实例并重复所选K值的计算过程来执行。
此外,它需要相当高的数据量来进行现实的预测,并且对分析数据的噪声敏感。 在下一个例子中,我们将使用MNIST数据集来实现KNN算法。 建立训练集
让我们从模拟所需的导入库开始: [mw_shl_code=python,true]import numpy as np
import tensorflow as tf
import input_data[/mw_shl_code]要构造训练集的数据模型,请使用前面介绍的input_data.read_data_sets函数: [mw_shl_code=python,true]mnist = input_data.read_data_sets("/tmp/data/", one_hot=True)[/mw_shl_code]在我们的例子中,我们将采取由100个MNIST图像组成的训练阶段: [mw_shl_code=python,true]train_pixels,train_list_values = mnist.train.next_batch(100) [/mw_shl_code]当我们测试我们的算法为10图像时: [mw_shl_code=python,true]test_pixels,test_list_of_values = mnist.test.next_batch(10) [/mw_shl_code]最后,我们定义我们用来构造分类器的张量train_pixel_tensor和test_pixel_tensor [mw_shl_code=python,true]train_pixel_tensor = tf.placeholder\
("float", [None, 784])
test_pixel_tensor = tf.placeholder\
("float", [784])[/mw_shl_code]
成本函数和优化
成本函数由以像素表示的距离来表示: [mw_shl_code=python,true]distance = tf.reduce_sum\
(tf.abs\
(tf.add(train_pixel_tensor, \
tf.neg(test_pixel_tensor))), \
reduction_indices=1)[/mw_shl_code]tf.reduce函数sum计算张量维度上元素的总和。 例如(来自TensorFlow在线手册): [mw_shl_code=python,true]# 'x' is [[1, 1, 1]
# [1, 1, 1]]
tf.reduce_sum(x) ==> 6
tf.reduce_sum(x, 0) ==> [2, 2, 2]
tf.reduce_sum(x, 1) ==> [3, 3]
tf.reduce_sum(x, 1, keep_dims=True) ==> [[3], [3]]
tf.reduce_sum(x, [0, 1]) ==> 6[/mw_shl_code]最后,为了最小化距离函数,我们使用arg_min,它返回距离最近的索引(最近邻居): [mw_shl_code=python,true]pred = tf.arg_min(distance, 0)[/mw_shl_code]
测试和算法评估
精度是帮助我们计算分类器最终结果的一个参数: [mw_shl_code=python,true]accuracy = 0[/mw_shl_code]初始化变量: [mw_shl_code=python,true]init = tf.initialize_all_variables()[/mw_shl_code]开始模拟: [mw_shl_code=python,true]with tf.Session() as sess:
sess.run(init)
for i in range(len(test_list_of_values)):[/mw_shl_code]然后我们使用前面定义的pred函数来评估最近邻的索引: [mw_shl_code=python,true]nn_index = sess.run(pred,\
feed_dict={train_pixel_tensor:train_pixels,\
test_pixel_tensor:test_pixels[i,:]})[/mw_shl_code]最后,我们找到最近的邻居类别标签,并将其与其真实标签进行比较: [mw_shl_code=python,true] print "Test N° ", i,"Predicted Class: ", \
np.argmax(train_list_values[nn_index]),\
"True Class: ", np.argmax(test_list_of_values)
if np.argmax(train_list_values[nn_index])\
== np.argmax(test_list_of_values):[/mw_shl_code]然后我们评估并报告分类器的准确性: [mw_shl_code=python,true] accuracy += 1./len(test_pixels)
print "Result = ", accuracy[/mw_shl_code]正如我们所看到的,训练集的每个元素都被正确分类。 仿真结果显示预测的类别与实际的类别,最后报告的仿真总值: [mw_shl_code=python,true]>>>
Extracting /tmp/data/train-labels-idx1-ubyte.gz Extracting /tmp/data/t10k-images-idx3-ubyte.gz
Extracting /tmp/data/t10k-labels-idx1-ubyte.gz
Test N° 0 Predicted Class: 7 True Class: 7
Test N° 1 Predicted Class: 2 True Class: 2
Test N° 2 Predicted Class: 1 True Class: 1
Test N° 3 Predicted Class: 0 True Class: 0
Test N° 4 Predicted Class: 4 True Class: 4
Test N° 5 Predicted Class: 1 True Class: 1
Test N° 6 Predicted Class: 4 True Class: 4
Test N° 7 Predicted Class: 9 True Class: 9
Test N° 8 Predicted Class: 6 True Class: 5
Test N° 9 Predicted Class: 9 True Class: 9
Result = 0.9
>>>[/mw_shl_code]结果不是100%准确;原因在于它是在对测试编号错误的评估中。 8而不是5,分类器评分为6。 最后,我们报告完整的KNN分类代码: [mw_shl_code=python,true]import numpy as np
import tensorflow as tf
import input_data
#Build the Training Set
mnist = input_data.read_data_sets("/tmp/data/", one_hot=True)
train_pixels,train_list_values = mnist.train.next_batch(100)
test_pixels,test_list_of_values = mnist.test.next_batch(10)
train_pixel_tensor = tf.placeholder\
("float", [None, 784])
test_pixel_tensor = tf.placeholder\
("float", [784])
#Cost Function and distance optimization
distance = tf.reduce_sum\
(tf.abs\
(tf.add(train_pixel_tensor, \
tf.neg(test_pixel_tensor))), \
reduction_indices=1)
pred = tf.arg_min(distance, 0)
# Testing and algorithm evaluation
accuracy = 0.
init = tf.initialize_all_variables()
with tf.Session() as sess:
sess.run(init)
for i in range(len(test_list_of_values)):
nn_index = sess.run(pred,\
feed_dict={train_pixel_tensor:train_pixels,\
test_pixel_tensor:test_pixels[i,:]})
print "Test N° ", i,"Predicted Class: ", \
np.argmax(train_list_values[nn_index]),\
"True Class: ", np.argmax(test_list_of_values)
if np.argmax(train_list_values[nn_index])\
== np.argmax(test_list_of_values):
accuracy += 1./len(test_pixels)
print "Result = ", accuracy[/mw_shl_code]
Data clustering
聚类问题在于从一组初始数据中选择和分组同质项目。 要解决这个问题,我们必须: - Identify a resemblance measure between elements
- 找出是否存在similar的所选元素的子集
该算法确定哪些元素形成一个聚类,以及在聚类内什么程度的相似性。 The clustering algorithms fall into the unsupervised methods, because we do not assume any prior information on the structures and characteristics of the clusters.
The k-means algorithm
One of the most common and simple clustering algorithms is k-means, which allows subdividing groups of objects into k partitions on the basis of their attributes. 每个簇由point或centroid average标识。
该算法遵循迭代过程: - 随机选择K个点作为初始质心。
- 重复。
- 通过将所有点分配给最接近的质心来形成K个簇。
- 重新计算每个群集的质心。
- 直到质心不变。
The popularity of the k-means comes from its convergence speed and its 易于执行。 在解决方案的质量方面,算法并不能保证达到全局最优。 The quality of the final solution dependslargely on the initial set of clusters and may, in practice, to obtain a much worse the global optimum solution. 由于该算法速度极快,因此您可以多次应用该算法,并生成可以从中选择最满意的解决方案。 该算法的另一个缺点是它需要你选择要查找的聚类数(k)。 如果数据不是自然分区的,最终会得到奇怪的结果。 而且,只有在数据中存在可识别的球状星团时,该算法才能正常工作。
现在让我们看看如何通过TensorFlow库实现k-means。
Building the training set
将所有必要的库导入到我们的模拟中: [mw_shl_code=python,true]import matplotlib.pyplot as plt
import numpy as np
import tensorflow as tf
import pandas as pd[/mw_shl_code]
T0>注意
Pandas是一个开源的,易于使用的数据结构,以及用于Python编程语言的数据分析工具。 要安装它,请键入以下命令:
[mw_shl_code=python,true]sudo pip install pandas[/mw_shl_code]我们必须定义我们问题的参数。 我们要聚类的总点数是1000分: [mw_shl_code=python,true]num_vectors = 1000[/mw_shl_code]所有初始化您想要达到的分区数量: [mw_shl_code=python,true]num_clusters = 4[/mw_shl_code]我们设置k-means算法的计算步数: [mw_shl_code=python,true]num_steps = 100[/mw_shl_code]我们初始化初始输入数据结构: [mw_shl_code=python,true]x_values = []
y_values = []
vector_values = [][/mw_shl_code]training set创建一个随机的点集,这就是为什么我们使用random.normal NumPy函数,允许我们构建x_values和y_values向量: [mw_shl_code=python,true]for i in xrange(num_vectors):
if np.random.random() > 0.5:
x_values.append(np.random.normal(0.4, 0.7))
y_values.append(np.random.normal(0.2, 0.8))
else:
x_values.append(np.random.normal(0.6, 0.4))
y_values.append(np.random.normal(0.8, 0.5))[/mw_shl_code]我们使用Python zip函数获取vector_values的完整列表: [mw_shl_code=python,true]vector_values = zip(x_values,y_values)[/mw_shl_code]Then vector_values is converted into a constant, usable by TensorFlow: [mw_shl_code=python,true]vectors = tf.constant(vector_values)[/mw_shl_code]我们可以看到我们的training set为聚类算法用以下命令: [mw_shl_code=python,true]plt.plot(x_values,y_values, 'o', label='Input Data')
plt.legend()
plt.show()[/mw_shl_code]
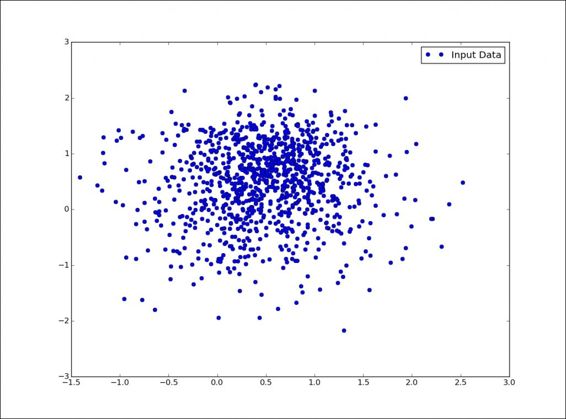
k-means的训练集
After randomly building the training set, we have to generate (k = 4) centroid, then determine an index using tf.random_shuffle: [mw_shl_code=python,true]n_samples = tf.shape(vector_values)[0]
random_indices = tf.random_shuffle(tf.range(0, n_samples))
[/mw_shl_code]通过采用这个程序,我们能够确定四个随机指标:[mw_shl_code=python,true]begin = [0,]
size = [num_clusters,]
size[0] = num_clusters[/mw_shl_code]他们有我们最初质心的自己的指标: [mw_shl_code=python,true]centroid_indices = tf.slice(random_indices, begin, size)
centroids = tf.Variable(tf.gather\
(vector_values, centroid_indices))[/mw_shl_code]
Cost functions and optimization
我们想为这个问题最小化的代价函数又是两点之间的欧氏距离:

In order to manage the tensors defined previously, vectors and centroids, we use the TensorFlow function expand_dims, which automatically expands the size of the two arguments: [mw_shl_code=python,true]expanded_vectors = tf.expand_dims(vectors, 0)
expanded_centroids = tf.expand_dims(centroids, 1)
[/mw_shl_code]这个函数允许你标准化两张张的形状,以便通过tf.sub方法评估差异:[mw_shl_code=python,true]vectors_subtration = tf.sub(expanded_vectors,expanded_centroids)[/mw_shl_code]Finally, we build the euclidean_distances cost function, using the tf.reduce_sum function, which computes the sum of elements across the dimensions of a tensor, while the tf.squarefunction computes the square of the vectors_subtration element-wise tensor: [mw_shl_code=python,true]euclidean_distances = tf.reduce_sum(tf.square\
(vectors_subtration), 2)
assignments = tf.to_int32(tf.argmin(euclidean_distances, 0))[/mw_shl_code]Here assignments is the value of the index with the smallest distance across the tensor euclidean_distances. 现在让我们转到优化阶段,其目的是改善群集构建所依赖的质心的选择。 我们使用来自赋值的索引,将向量(即我们的training set)分割为个num_clusters张量。 以下代码为每个样本取最近的索引,并使用tf.dynamic_partition将其作为单独的组抓取: [mw_shl_code=python,true]partitions = tf.dynamic_partition\
(vectors, assignments, num_clusters)[/mw_shl_code]最后,我们使用tf.reduce_mean来更新质心,找到该组的平均值,形成新的质心: [mw_shl_code=python,true]update_centroids = tf.concat(0, \
[tf.expand_dims\
(tf.reduce_mean(partition, 0), 0)\
for partition in partitions])
[/mw_shl_code]为了形成update_centroids张量,我们使用tf.concat连接单个。
测试和算法评估
现在是测试和评估算法的时候了。 第一个过程是初始化所有变量并实例化评估图: [mw_shl_code=python,true]init_op = tf.initialize_all_variables()
sess = tf.Session()
sess.run(init_op)[/mw_shl_code]现在我们开始计算: [mw_shl_code=python,true]for step in xrange(num_steps):
_, centroid_values, assignment_values =\
sess.run([update_centroids,\
centroids,\
assignments])[/mw_shl_code]为了显示结果,我们实现了以下功能: [mw_shl_code=python,true]display_partition(x_values,y_values,assignment_values)
[/mw_shl_code]这需要训练集的x_values和y_values向量以及assignemnt_values向量绘制集群。这个可视化函数的代码如下: [mw_shl_code=python,true]def display_partition(x_values,y_values,assignment_values):
labels = []
colors = ["red","blue","green","yellow"]
for i in xrange(len(assignment_values)):
labels.append(colors[(assignment_values)])
color = labels
df = pd.DataFrame\
(dict(x =x_values,y = y_values ,color = labels ))
fig, ax = plt.subplots()
ax.scatter(df['x'], df['y'], c=df['color'])
plt.show()[/mw_shl_code]它通过以下数据结构将每个组的颜色关联起来: [mw_shl_code=python,true]colors = ["red","blue","green","yellow"][/mw_shl_code]然后通过matplotlib的scatter函数绘制它们: [mw_shl_code=python,true]ax.scatter(df['x'], df['y'], c=df['color'])[/mw_shl_code]让我们显示结果:
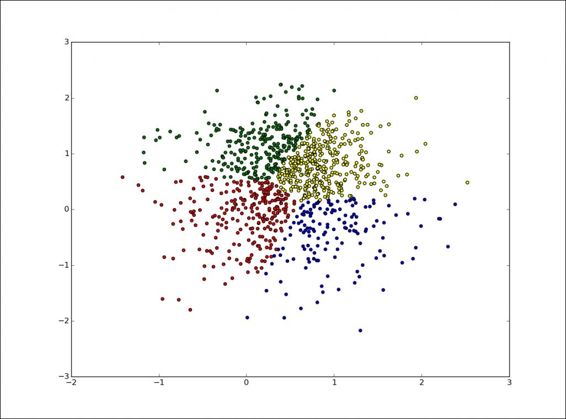
k-means算法的最终结果
以下是k-means算法的完整代码: [mw_shl_code=python,true]import matplotlib.pyplot as plt
import numpy as np
import pandas as pd
import tensorflow as tf
def display_partition(x_values,y_values,assignment_values):
labels = []
colors = ["red","blue","green","yellow"]
for i in xrange(len(assignment_values)):
labels.append(colors[(assignment_values)])
color = labels
df = pd.DataFrame\
(dict(x =x_values,y = y_values ,color = labels ))
fig, ax = plt.subplots()
ax.scatter(df['x'], df['y'], c=df['color'])
plt.show()
num_vectors = 2000
num_clusters = 4
n_samples_per_cluster = 500
num_steps = 1000
x_values = []
y_values = []
vector_values = []
#CREATE RANDOM DATA
for i in xrange(num_vectors):
if np.random.random() > 0.5:
x_values.append(np.random.normal(0.4, 0.7))
y_values.append(np.random.normal(0.2, 0.8))
else:
x_values.append(np.random.normal(0.6, 0.4))
y_values.append(np.random.normal(0.8, 0.5))
vector_values = zip(x_values,y_values)
vectors = tf.constant(vector_values)
n_samples = tf.shape(vector_values)[0]
random_indices = tf.random_shuffle(tf.range(0, n_samples))
begin = [0,]
size = [num_clusters,]
size[0] = num_clusters
centroid_indices = tf.slice(random_indices, begin, size)
centroids = tf.Variable(tf.gather(vector_values, centroid_indices))
expanded_vectors = tf.expand_dims(vectors, 0)
expanded_centroids = tf.expand_dims(centroids, 1)
vectors_subtration = tf.sub(expanded_vectors,expanded_centroids)
euclidean_distances =
\tf.reduce_sum(tf.square(vectors_subtration), 2)
assignments = tf.to_int32(tf.argmin(euclidean_distances, 0))
partitions = [0, 0, 1, 1, 0]
num_partitions = 2
data = [10, 20, 30, 40, 50]
outputs[0] = [10, 20, 50]
outputs[1] = [30, 40]
partitions = tf.dynamic_partition(vectors, assignments, num_clusters)
update_centroids = tf.concat(0, [tf.expand_dims (tf.reduce_mean(partition, 0), 0)\
for partition in partitions])
init_op = tf.initialize_all_variables()
sess = tf.Session()
sess.run(init_op)
for step in xrange(num_steps):
_, centroid_values, assignment_values =\
sess.run([update_centroids,\
centroids,\
assignments])
display_partition(x_values,y_values,assignment_values)
plt.plot(x_values,y_values, 'o', label='Input Data')
plt.legend()
plt.show()[/mw_shl_code]
Summary
在本章中,我们开始探讨TensorFlow在机器学习中的一些典型问题的潜力。 With the linear regression algorithm, the important concepts of cost function and optimization using gradient descent were explained. 然后我们描述了手写数字的数据集MNIST。 我们还使用nearest neighbor算法实现了多类分类器,该算法属于机器学习领域 监督学习 类别。 Then the chapter concluded with an example of unsupervised learning, by implementing the k-means algorithm for solving a data clustering problem.
在下一章中,我们将介绍神经网络。 These are mathematical models that represent the interconnection between elements defined as artificial neurons, namely mathematical constructs that mimic the properties of living neurons. 我们还将使用TensorFlow实现一些神经网络学习模型。
作者:usyiyi.cn
|
 /2
/2 