问题导读:
1、如何创建两个具有相同结构的单层神经网络?
2、如何声明两个模型参数?
3、如何设置迭代次数和激活函数?
4、如何理解完全连接的神经网络?
关注最新经典文章,欢迎关注公众号

上一篇:TensorFlow ML cookbook 第六章1节 神经网络-实施操作入门
使用门和激活功能
现在我们可以将操作门连接在一起,我们将希望通过激活函数运行计算图输出。 这里我们介绍常见的激活功能。
做好准备
在本节中,我们将比较和对比两种不同的激活函数,即S形和整流线性单元(ReLU)。 回想一下,这两个函数由以下等式给出:

在这个例子中,我们将创建两个具有相同结构的单层神经网络,除了一个将通过sigmoid激活并且一个将通过ReLU激活。 损失函数将由距离值0.75的L2距离控制。 我们将从正态分布中随机抽取批次数据(正常(平均值= 2,sd = 0.1)),并将输出优化为0.75。
怎么做…
1.我们首先加载必要的库并初始化图形。 这也是提出如何使用TensorFlow设置随机种子的一个好点。 由于我们将使用来自NumPy和TensorFlow的随机数生成器,因此我们需要为两者设置随机种子。 使用相同的随机种子集,我们应该能够复制:
[mw_shl_code=python,true]import tensorflow as tf
import numpy as np
import matplotlib.pyplot as plt
sess = tf.Session()
tf.set_random_seed(5)
np.random.seed(42) [/mw_shl_code]
2.现在我们将声明我们的批量大小,模型变量,数据和占位符来输入数据。我们的计算图将包括将我们的正态分布数据输入两个相似的神经网络,这两个神经网络的区别仅在于激活函数。 结束:
[mw_shl_code=python,true]batch_size = 50
a1 = tf.Variable(tf.random_normal(shape=[1,1]))
b1 = tf.Variable(tf.random_uniform(shape=[1,1]))
a2 = tf.Variable(tf.random_normal(shape=[1,1]))
b2 = tf.Variable(tf.random_uniform(shape=[1,1]))
x = np.random.normal(2, 0.1, 500)
x_data = tf.placeholder(shape=[None, 1], dtype=tf.float32) [/mw_shl_code]
3.接下来,我们将声明我们的两个模型,即sigmoid激活模型和ReLU激活模型:
[mw_shl_code=python,true]sigmoid_activation = tf.sigmoid(tf.add(tf.matmul(x_data, a1), b1))
relu_activation = tf.nn.relu(tf.add(tf.matmul(x_data, a2), b2)) [/mw_shl_code]
4.损失函数将是模型输出与0.75值之间的平均L2范数:
[mw_shl_code=python,true]loss1 = tf.reduce_mean(tf.square(tf.sub(sigmoid_activation, 0.75)))
loss2 = tf.reduce_mean(tf.square(tf.sub(relu_activation, 0.75)))[/mw_shl_code]
5.现在我们声明我们的优化算法并初始化我们的变量:
[mw_shl_code=python,true]my_opt = tf.train.GradientDescentOptimizer(0.01)
train_step_sigmoid = my_opt.minimize(loss1)
train_step_relu = my_opt.minimize(loss2)
init = tf.initialize_all_variables()
sess.run(init) [/mw_shl_code]
6.现在,我们将针对两种模型循环完成750次迭代的培训。 我们还将保存损失输出和激活输出值,以便在以下情况下进行绘图:
[mw_shl_code=python,true]loss_vec_sigmoid = []
loss_vec_relu = []
activation_sigmoid = []
activation_relu = []
for i in range(750):
rand_indices = np.random.choice(len(x), size=batch_size)
x_vals = np.transpose([x[rand_indices]])
sess.run(train_step_sigmoid, feed_dict={x_data: x_vals})
sess.run(train_step_relu, feed_dict={x_data: x_vals})
loss_vec_sigmoid.append(sess.run(loss1, feed_dict={x_data: x_ vals}))
loss_vec_relu.append(sess.run(loss2, feed_dict={x_data: x_ vals}))
activation_sigmoid.append(np.mean(sess.run(sigmoid_activation, feed_dict={x_data: x_vals})))
activation_relu.append(np.mean(sess.run(relu_activation, feed_ dict={x_data: x_vals}))) [/mw_shl_code]
7.以下是绘制损失和激活输出的代码:[mw_shl_code=python,true]plt.plot(activation_sigmoid, 'k-', label='Sigmoid Activation')
plt.plot(activation_relu, 'r--', label='Relu Activation')
plt.ylim([0, 1.0])
plt.title('Activation Outputs')
plt.xlabel('Generation')
plt.ylabel('Outputs')
plt.legend(loc='upper right')
plt.show()
plt.plot(loss_vec_sigmoid, 'k-', label='Sigmoid Loss')
plt.plot(loss_vec_relu, 'r--', label='Relu Loss')
plt.ylim([0, 1.0])
plt.title('Loss per Generation')
plt.xlabel('Generation')
plt.ylabel('Loss')
plt.legend(loc='upper right')
plt.show()[/mw_shl_code]
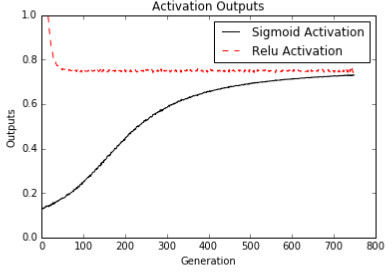
图2:具有S形激活的网络和具有ReLU激活的网络的计算图输出。
两个神经网络使用相似的架构和目标(0.75),具有两个不同的激活函数,sigmoid和ReLU。 重要的是要注意ReLU激活网络收敛到所需的目标0.75比Sigmoid快多少:

图3:该图描绘了S形和ReLU激活网络的损耗值。 注意迭代开始时ReLU损失的极端程度。
这个怎么运作…
由于ReLU激活函数的形式,它比sigmoid函数更频繁地返回零值。 我们将此行为视为一种稀疏性。 这种稀疏性导致收敛速度加快,但失去了受控梯度。 另一方面,S形函数具有非常良好控制的梯度,并且不会冒ReLU激活所做的极端值的风险:

还有更多…
在本节中,我们比较了ReLU激活函数和神经网络的S形激活。还有许多其他激活函数通常用于神经网络,但大多数属于两类之一:第一类包含形状类似于sigmoid函数(arctan,hypertangent,heavyyside step等)的函数和第二类category包含形状类似ReLU函数的函数(softplus,leaky ReLU等)。本节中讨论的关于比较两个函数的大部分内容都适用于任一类别的激活。然而,重要的是要注意激活函数的选择对神经网络的收敛和输出有很大影响。
实现单层神经网络
我们拥有所有工具来实现对真实数据进行操作的神经网络。我们将创建一个神经网络,其中一个层在Iris数据集上运行。
做好准备
在本节中,我们将实现一个具有一个隐藏层的神经网络。重要的是要理解完全连接的神经网络主要基于矩阵乘法。因此,数据和矩阵的尺寸对于正确排列非常重要。
由于这是一个回归问题,我们将使用均方误差作为损失函数。
怎么做…
1.要创建计算图,我们首先加载必要的库:
[mw_shl_code=python,true]import matplotlib.pyplot as plt
import numpy as np
import tensorflow as tf
from sklearn import datasets [/mw_shl_code]
2.现在我们将加载Iris数据并将踏板长度存储为目标值。 然后我们将开始图形会话:
[mw_shl_code=python,true]iris = datasets.load_iris()
x_vals = np.array([x[0:3] for x in iris.data])
y_vals = np.array([x[3] for x in iris.data])
sess = tf.Session() [/mw_shl_code]
3.由于数据集的大小较小,我们希望设置种子以使结果可重复:
[mw_shl_code=python,true]seed = 2
tf.set_random_seed(seed)
np.random.seed(seed) [/mw_shl_code]
4.为了准备数据,我们将创建一个80-20列车测试分割,并通过最小 - 最大缩放将x特征标准化为0到1之间:
[mw_shl_code=python,true]train_indices = np.random.choice(len(x_vals), round(len(x_ vals)*0.8), replace=False)
test_indices = np.array(list(set(range(len(x_vals))) - set(train_ indices)))
x_vals_train = x_vals[train_indices]
x_vals_test = x_vals[test_indices]
y_vals_train = y_vals[train_indices]
y_vals_test = y_vals[test_indices]
def normalize_cols(m):
col_max = m.max(axis=0)
col_min = m.min(axis=0)
return (m-col_min) / (col_max - col_min)
x_vals_train = np.nan_to_num(normalize_cols(x_vals_train))
x_vals_test = np.nan_to_num(normalize_cols(x_vals_test)) [/mw_shl_code]
5.现在我们将声明数据和目标的批量大小和占位符:
[mw_shl_code=python,true]batch_size = 50
x_data = tf.placeholder(shape=[None, 3], dtype=tf.float32)
y_target = tf.placeholder(shape=[None, 1], dtype=tf.float32)[/mw_shl_code]
6.重要的部分是用适当的形状声明我们的模型变量。 我们可以将隐藏层的大小声明为我们希望的任何大小; 这里我们将它设置为有五个隐藏节点:
[mw_shl_code=python,true]hidden_layer_nodes = 5
A1 = tf.Variable(tf.random_normal(shape=[3,hidden_layer_nodes]))
b1 = tf.Variable(tf.random_normal(shape=[hidden_layer_nodes]))
A2 = tf.Variable(tf.random_normal(shape=[hidden_layer_nodes,1]))
b2 = tf.Variable(tf.random_normal(shape=[1])) [/mw_shl_code]
7.我们现在分两步宣布我们的模型。 第一步是创建隐藏层输出,第二步是创建模型的最终输出:
[mw_shl_code=python,true]hidden_output = tf.nn.relu(tf.add(tf.matmul(x_data, A1), b1))
final_output = tf.nn.relu(tf.add(tf.matmul(hidden_output, A2), b2)) [/mw_shl_code]
8.这是我们的均方误差作为损失函数:
[mw_shl_code=python,true]loss = tf.reduce_mean(tf.square(y_target - final_output)) [/mw_shl_code]
9.现在我们将声明我们的优化算法并初始化我们的变量:
[mw_shl_code=python,true]my_opt = tf.train.GradientDescentOptimizer(0.005)
train_step = my_opt.minimize(loss)
init = tf.initialize_all_variables()
sess.run(init) [/mw_shl_code]
10.接下来我们循环训练迭代。 我们还将初始化两个列表,我们可以存储我们的列车和测试损失。 在每个循环中,我们还想从训练数据中随机选择一个批处理以适合模型:[mw_shl_code=python,true]# First we initialize the loss vectors for storage.
loss_vec = []
test_loss = []
for i in range(500):
# First we select a random set of indices for the batch.
rand_index = np.random.choice(len(x_vals_train), size=batch_ size)
# We then select the training values
rand_x = x_vals_train[rand_index]
rand_y = np.transpose([y_vals_train[rand_index]])
# Now we run the training step
sess.run(train_step, feed_dict={x_data: rand_x, y_target:rand_y})
# We save the training loss
temp_loss = sess.run(loss, feed_dict={x_data: rand_x, y_ target: rand_y})
loss_vec.append(np.sqrt(temp_loss))
# Finally, we run the test-set loss and save it.
test_temp_loss = sess.run(loss, feed_dict={x_data: x_vals_ test, y_target: np.transpose([y_vals_test])})
test_loss.append(np.sqrt(test_temp_loss))
if (i+1)%50==0:
print('Generation: ' + str(i+1) + '. Loss = ' + str(temp_ loss))
[/mw_shl_code]
11.以下是我们如何使用matplotlib绘制损失:
[mw_shl_code=python,true]plt.plot(loss_vec, 'k-', label='Train Loss')
plt.plot(test_loss, 'r--', label='Test Loss')
plt.title('Loss (MSE) per Generation')
plt.xlabel('Generation')
plt.ylabel('Loss')
plt.legend(loc='upper right')
plt.show()[/mw_shl_code]
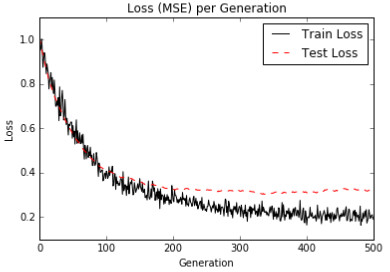
图4:我们绘制了列车和测试装置的损失(MSE)。 请注意,我们在200代之后略微过度拟合了模型,因为测试MSE不再下降,但是训练MSE确实继续下降。
这个怎么运作…
要将我们的模型可视化为神经网络图,请参考下图:
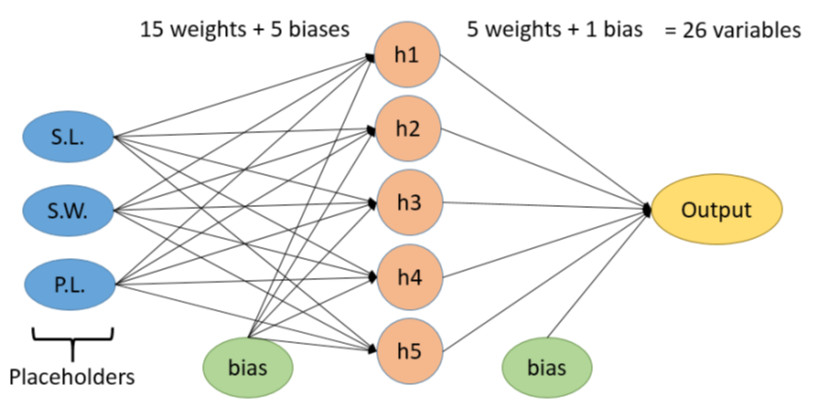
图5:这是我们的神经网络的可视化,在隐藏层中有五个节点。 我们喂三个值,萼片长度(S.L),萼片宽度(S.W.)和踏板长度(P.L.)。 目标将是花瓣宽度。 总的来说,模型中总共有26个变量。
还有更多…
请注意,我们可以通过查看测试和训练集上的损失函数来确定模型何时开始过度拟合训练数据。 我们还可以看到列车损失远不如测试集。 这是因为有两个原因:第一个是我们使用的批量小于测试集,虽然不是很多,第二个是我们在列车集上进行训练而测试集不会影响变量 该模型。
原文:
Working with Gates and Activation Functions
Now that we can link together operational gates, we will want to run the computational graph output through an activation function. Here we introduce common activation functions.
Getting ready
In this section, we will compare and contrast two different activation functions, the sigmoid and the rectified linear unit (ReLU). Recall that the two functions are given by the following equations:

In this example, we will create two one-layer neural networks with the same structure except one will feed through the sigmoid activation and one will feed through the ReLU activation. The loss function will be governed by the L2 distance from the value 0.75. We will randomly pull batch data from a normal distribution (Normal(mean=2, sd=0.1)), and optimize the output towards 0.75.
How to do it…
1.We'll start by loading the necessary libraries and initializing a graph. This is also a good point to bring up how to set a random seed with TensorFlow. Since we will be using a random number generator from NumPy and TensorFlow, we need to set a random seed for both. With the same random seeds set, we should be able to replicate:
import tensorflow as tf
import numpy as np
import matplotlib.pyplot as plt
sess = tf.Session()
tf.set_random_seed(5)
np.random.seed(42)
2.Now we'll declare our batch size, model variables, data, and a placeholder for feeding the data in. Our computational graph will consist of feeding in our normally distributed data into two similar neural networks that differ only by the activation function at the end:
batch_size = 50
a1 = tf.Variable(tf.random_normal(shape=[1,1]))
b1 = tf.Variable(tf.random_uniform(shape=[1,1]))
a2 = tf.Variable(tf.random_normal(shape=[1,1]))
b2 = tf.Variable(tf.random_uniform(shape=[1,1]))
x = np.random.normal(2, 0.1, 500)
x_data = tf.placeholder(shape=[None, 1], dtype=tf.float32)
3.Next, we'll declare our two models, the sigmoid activation model and the ReLU activation model:
sigmoid_activation = tf.sigmoid(tf.add(tf.matmul(x_data, a1), b1))
relu_activation = tf.nn.relu(tf.add(tf.matmul(x_data, a2), b2))
4.The loss functions will be the average L2 norm between the model output and the value of 0.75:
loss1 = tf.reduce_mean(tf.square(tf.sub(sigmoid_activation, 0.75)))
loss2 = tf.reduce_mean(tf.square(tf.sub(relu_activation, 0.75)))
5.Now we declare our optimization algorithm and initialize our variables:
my_opt = tf.train.GradientDescentOptimizer(0.01)
train_step_sigmoid = my_opt.minimize(loss1)
train_step_relu = my_opt.minimize(loss2)
init = tf.initialize_all_variables()
sess.run(init)
6.Now we'll loop through our training for 750 iterations for both models. We will also save the loss output and the activation output values for plotting after:
loss_vec_sigmoid = []
loss_vec_relu = []
activation_sigmoid = []
activation_relu = []
for i in range(750):
rand_indices = np.random.choice(len(x), size=batch_size)
x_vals = np.transpose([x[rand_indices]])
sess.run(train_step_sigmoid, feed_dict={x_data: x_vals})
sess.run(train_step_relu, feed_dict={x_data: x_vals})
loss_vec_sigmoid.append(sess.run(loss1, feed_dict={x_data: x_ vals}))
loss_vec_relu.append(sess.run(loss2, feed_dict={x_data: x_ vals}))
activation_sigmoid.append(np.mean(sess.run(sigmoid_activation, feed_dict={x_data: x_vals})))
activation_relu.append(np.mean(sess.run(relu_activation, feed_ dict={x_data: x_vals})))
7.The following is the code to plot the loss and the activation outputs:
plt.plot(activation_sigmoid, 'k-', label='Sigmoid Activation')
plt.plot(activation_relu, 'r--', label='Relu Activation')
plt.ylim([0, 1.0])
plt.title('Activation Outputs')
plt.xlabel('Generation')
plt.ylabel('Outputs')
plt.legend(loc='upper right')
plt.show()
plt.plot(loss_vec_sigmoid, 'k-', label='Sigmoid Loss')
plt.plot(loss_vec_relu, 'r--', label='Relu Loss')
plt.ylim([0, 1.0])
plt.title('Loss per Generation')
plt.xlabel('Generation')
plt.ylabel('Loss')
plt.legend(loc='upper right')
plt.show()
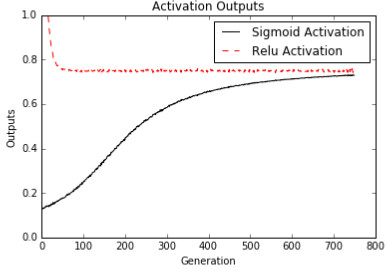
Figure 2: Computational graph outputs from the network with the sigmoid activation and a network with the ReLU activation.
The two neural networks work with similar architecture and target (0.75) with two different activation functions, sigmoid and ReLU. It is important to notice how much quicker the ReLU activation network converges to the desired target of 0.75 than sigmoid:
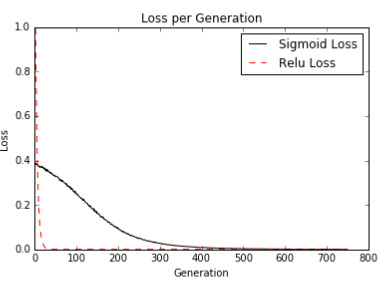
Figure 3: This figure depicts the loss value of the sigmoid and the ReLU activation networks. Notice how extreme the ReLU loss is at the beginning of the iterations.
How it works…
Because of the form of the ReLU activation function, it returns the value of zero much more often than the sigmoid function. We consider this behavior as a type of sparsity. This sparsity results in a speed up of convergence, but a loss of controlled gradients. On the other hand, the sigmoid function has very well-controlled gradients and does not risk the extreme values that the ReLU activation does:

There's more…
In this section, we compared the ReLU activation function and the sigmoid activation for neural networks. There are many other activation functions that are commonly used for neural networks, but most fall into one of two categories: the first category contains functions that are shaped like the sigmoid function (arctan, hypertangent, heavyside step, and so on) and the second category contains functions that are shaped like the ReLU function (softplus, leaky ReLU, and so on). Most of what was discussed in this section about comparing the two functions will hold true for activations in either category. However, it is important to note that the choice of the activation function has a big impact on the convergence and output of the neural networks.
Implementing a One-Layer Neural Network
We have all the tools to implement a neural network that operates on real data. We will create a neural network with one layer that operates on the Iris dataset.
Getting ready
In this section, we will implement a neural network with one hidden layer. It will be important to understand that a fully connected neural network is based mostly on matrix multiplication. As such, the dimensions of the data and matrix are very important to get lined up correctly.
Since this is a regression problem, we will use the mean squared error as the loss function.
How to do it…
1.To create the computational graph, we'll start by loading the necessary libraries:
import matplotlib.pyplot as plt
import numpy as np
import tensorflow as tf
from sklearn import datasets
2.Now we'll load the Iris data and store the pedal length as the target value. Then we'll start a graph session:
iris = datasets.load_iris()
x_vals = np.array([x[0:3] for x in iris.data])
y_vals = np.array([x[3] for x in iris.data])
sess = tf.Session()
3.Since the dataset is of a smaller size, we want to set a seed to make the results reproducible:
seed = 2
tf.set_random_seed(seed)
np.random.seed(seed)
4.To prepare the data, we'll create a 80-20 train-test split and normalize the x features to be between 0 and 1 via min-max scaling:
train_indices = np.random.choice(len(x_vals), round(len(x_ vals)*0.8), replace=False)
test_indices = np.array(list(set(range(len(x_vals))) - set(train_ indices)))
x_vals_train = x_vals[train_indices]
x_vals_test = x_vals[test_indices]
y_vals_train = y_vals[train_indices]
y_vals_test = y_vals[test_indices]
def normalize_cols(m):
col_max = m.max(axis=0)
col_min = m.min(axis=0)
return (m-col_min) / (col_max - col_min)
x_vals_train = np.nan_to_num(normalize_cols(x_vals_train))
x_vals_test = np.nan_to_num(normalize_cols(x_vals_test))
5.Now we will declare the batch size and placeholders for the data and target:
batch_size = 50
x_data = tf.placeholder(shape=[None, 3], dtype=tf.float32)
y_target = tf.placeholder(shape=[None, 1], dtype=tf.float32)
6.The important part is to declare our model variables with the appropriate shape. We can declare the size of our hidden layer to be any size we wish; here we set it to have five hidden nodes:
hidden_layer_nodes = 5
A1 = tf.Variable(tf.random_normal(shape=[3,hidden_layer_nodes]))
b1 = tf.Variable(tf.random_normal(shape=[hidden_layer_nodes]))
A2 = tf.Variable(tf.random_normal(shape=[hidden_layer_nodes,1]))
b2 = tf.Variable(tf.random_normal(shape=[1]))
7.We'll now declare our model in two steps. The first step will be creating the hidden layer output and the second will be creating the final output of the model:
hidden_output = tf.nn.relu(tf.add(tf.matmul(x_data, A1), b1))
final_output = tf.nn.relu(tf.add(tf.matmul(hidden_output, A2), b2))
8.Here is our mean squared error as a loss function:
loss = tf.reduce_mean(tf.square(y_target - final_output))
9.Now we'll declare our optimizing algorithm and initialize our variables:
my_opt = tf.train.GradientDescentOptimizer(0.005)
train_step = my_opt.minimize(loss)
init = tf.initialize_all_variables()
sess.run(init)
10.Next we loop through our training iterations. We'll also initialize two lists that we can store our train and test loss. In every loop we also want to randomly select a batch from the training data for fitting to the model:
# First we initialize the loss vectors for storage.
loss_vec = []
test_loss = []
for i in range(500):
# First we select a random set of indices for the batch.
rand_index = np.random.choice(len(x_vals_train), size=batch_ size)
# We then select the training values
rand_x = x_vals_train[rand_index]
rand_y = np.transpose([y_vals_train[rand_index]])
# Now we run the training step
sess.run(train_step, feed_dict={x_data: rand_x, y_target:rand_y})
# We save the training loss
temp_loss = sess.run(loss, feed_dict={x_data: rand_x, y_ target: rand_y})
loss_vec.append(np.sqrt(temp_loss))
# Finally, we run the test-set loss and save it.
test_temp_loss = sess.run(loss, feed_dict={x_data: x_vals_ test, y_target: np.transpose([y_vals_test])})
test_loss.append(np.sqrt(test_temp_loss))
if (i+1)%50==0:
print('Generation: ' + str(i+1) + '. Loss = ' + str(temp_ loss))
11.And here is how we can plot the losses with matplotlib:
plt.plot(loss_vec, 'k-', label='Train Loss')
plt.plot(test_loss, 'r--', label='Test Loss')
plt.title('Loss (MSE) per Generation')
plt.xlabel('Generation')
plt.ylabel('Loss')
plt.legend(loc='upper right')
plt.show()
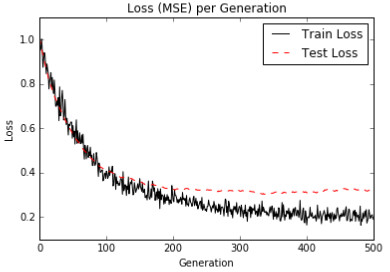
Figure 4: We plot the loss (MSE) of the train and test sets. Notice that we are slightly overfitting the model after 200 generations, as the test MSE does not drop any further, but the training MSE does continue to drop.
How it works…
To visualize our model as a neural network diagram, refer to the following figure:
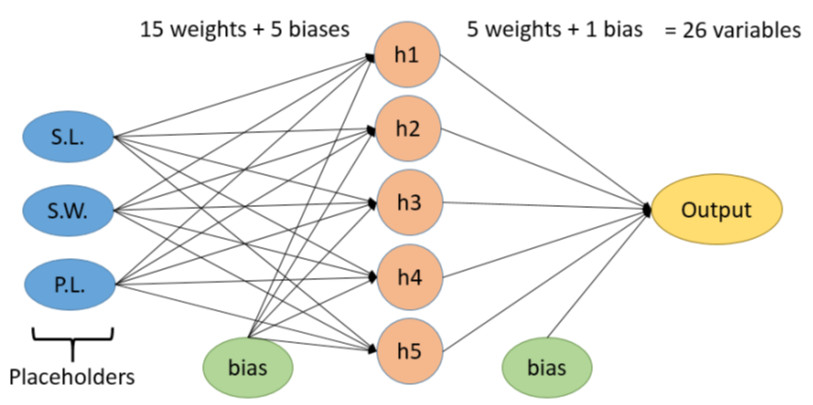
Figure 5: Here is a visualization of our neural network that has five nodes in the hidden layer. We are feeding in three values, the sepal length (S.L), the sepal width (S.W.), and the pedal length (P.L.). The target will be the petal width. In total, there will be 26 total variables in the model.
There's more…
Note that we can identify when the model starts overfitting on the training data from viewing the loss function on the test and train sets. We can also see that the train set loss is much less smooth than the test set. This is because of two reasons: the first is that we are using a smaller batch size than the test set, although not by much, and the second is that we are training on the train set and the test set does not impact the variables of the model.
|
 /2
/2 