本帖最后由 levycui 于 2018-4-27 11:39 编辑
问题导读:
1、如何使用矩阵求逆方法?
2、如何通过矩阵逆法获得的数据点和最佳拟合线?
3、如何实现分解方法?
4、如何学习回归的张量流法?

上一篇:TensorFlow ML cookbook 第二章8节 评估模型
线性回归
在本章中,我们将介绍用于了解TensorFlow如何工作以及如何访问本书和其他资源的数据的基本配方。 我们将涵盖以下领域:
- 使用矩阵求逆方法
- 实现分解方法
- 学习回归的张量流法
- 理解线性回归中的损失函数
- 实施戴明回归
- 实现套索和岭回归
- 实现弹性网络回归
- 实施回归Logistic回归
介绍
线性回归可能是统计学,机器学习和一般科学中最重要的算法之一。 它是最常用的算法之一,了解如何实现它以及它的各种风格非常重要。 线性回归优于许多其他算法的优点之一是它非常易于理解。 我们最终得到每个特征的数字,直接表示该特征如何影响目标或因变量。 在本章中,我们将介绍如何实现线性回归,然后继续研究如何在TensorFlow中最好地实现线性回归。 请记住,所有代码均可在GitHub在线https://github.com/nfmcclure/tensorflow_cookbook上获得。
使用矩阵求逆方法
在这个配方中,我们将使用TensorFlow用矩阵求逆方法求解二维线性回归。
准备好
比方说,线性回归可以表示为一组矩阵方程。 这里我们感兴趣的是求解矩阵x中的系数。 如果我们的观察矩阵(设计矩阵)A不是方形的,我们必须小心。 求解x的解决方案可以表示为。 为了表明这是事实,我们将生成二维数据,在TensorFlow中解决它,并绘制结果。
怎么做…
1.首先我们加载必要的库,初始化图形,并创建数据,如下所示:
[mw_shl_code=python,true]import matplotlib.pyplot as plt
import numpy as np
import tensorflow as tf
sess = tf.Session()
x_vals = np.linspace(0, 10, 100)
y_vals = x_vals + np.random.normal(0, 1, 100) [/mw_shl_code]
2.接下来,我们创建矩阵以逆方法使用。 我们首先创建A矩阵,它将是一列x数据和一列1。 然后我们从y数据创建b矩阵。 使用下面的代码:
[mw_shl_code=python,true]x_vals_column = np.transpose(np.matrix(x_vals))
ones_column = np.transpose(np.matrix(np.repeat(1, 100)))
A = np.column_stack((x_vals_column, ones_column))
b = np.transpose(np.matrix(y_vals)) [/mw_shl_code]
3.然后我们把我们的A和B矩阵变成张量,如下所示:
[mw_shl_code=python,true]A_tensor = tf.constant(A)
b_tensor = tf.constant(b) [/mw_shl_code]
4.现在我们已经建立了矩阵,我们可以使用TensorFlow通过矩阵逆方法来解决这个问题,如下所示:
[mw_shl_code=python,true]tA_A = tf.matmul(tf.transpose(A_tensor), A_tensor)
tA_A_inv = tf.matrix_inverse(tA_A)
product = tf.matmul(tA_A_inv, tf.transpose(A_tensor))
solution = tf.matmul(product, b_tensor)
solution_eval = sess.run(solution)[/mw_shl_code]
5.现在我们从解中提取系数,斜率和y截距,如下所示:
[mw_shl_code=python,true]slope = solution_eval[0][0]
y_intercept = solution_eval[1][0]
print('slope: ' + str(slope))
print('y'_intercept: ' + str(y_intercept))
slope: 0.955707151739
y_intercept: 0.174366829314
best_fit = []
for i in x_vals:
best_fit.append(slope*i+y_intercept)
plt.plot(x_vals, y_vals, 'o', label='Data')
plt.plot(x_vals, best_fit, 'r-', label='Best' fit line', linewidth=3)
plt.legend(loc='upper left')
plt.show() [/mw_shl_code]
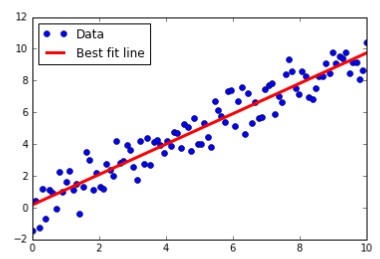
图1:通过矩阵逆法获得的数据点和最佳拟合线。
怎么运行的
与以前的食谱或本书中的大多数食谱不同,此处的解决方案完全可以通过矩阵操作找到。 我们将使用的大多数TensorFlow算法都是通过训练循环来实现的,并利用自动反向传播来更新模型变量。 在这里,我们通过实施直接解决方案来拟合数据模型来说明TensorFlow的多功能性。
实现分解方法
对于这个配方,我们将实现线性回归的矩阵分解方法。 具体而言,我们将使用Cholesky分解,在TensorFlow中存在相关函数。
准备好
在大多数情况下,在前面的配方中实现反演方法在数值上可能是低效的,特别是当矩阵变得非常大时。 另一种方法是分解A矩阵,并对分解进行矩阵运算。 其中一种方法是在TensorFlow中使用内置的Cholesky分解方法。 人们对将矩阵分解成更多矩阵如此感兴趣的一个原因是因为得到的矩阵将确保性质,使我们能够有效地使用某些方法。 例如,乔列斯基分解将矩阵分解为下三角矩阵和上三角矩阵
 ,使得这些矩阵是彼此的转置。 有关此分解属性的更多信息,有许多可用的资源来描述它以及如何到达它。 这里我们将解决这个系统

到达我们的系数矩阵x。
怎么做
1.我们将按照上一个配方完全相同的方式设置系统。 我们将导入库,初始化图形并创建数据。 然后,我们将以与之前相同的方式获得我们的A矩阵和B矩阵:
[mw_shl_code=python,true]import matplotlib.pyplot as plt
import numpy as np
import tensorflow as tf
from tensorflow.python.framework import ops
ops.reset_default_graph()
sess = tf.Session()
x_vals = np.linspace(0, 10, 100)
y_vals = x_vals + np.random.normal(0, 1, 100)
x_vals_column = np.transpose(np.matrix(x_vals))
ones_column = np.transpose(np.matrix(np.repeat(1, 100)))
A = np.column_stack((x_vals_column, ones_column))
b = np.transpose(np.matrix(y_vals))
A_tensor = tf.constant(A)
b_tensor = tf.constant(b) [/mw_shl_code]
2.接下来我们将找到我们矩阵的Cholesky分解,

请注意,TensorFlow函数cholesky()仅返回分解的较低对角线部分。 这很好,因为上对角矩阵只是较低的一个,转置。
[mw_shl_code=python,true]tA_A = tf.matmul(tf.transpose(A_tensor), A_tensor)
L = tf.cholesky(tA_A)
tA_b = tf.matmul(tf.transpose(A_tensor), b)
sol1 = tf.matrix_solve(L, tA_b)
sol2 = tf.matrix_solve(tf.transpose(L), sol1)[/mw_shl_code]
3.现在我们有解决方案,我们提取系数:
[mw_shl_code=python,true]solution_eval = sess.run(sol2)
slope = solution_eval[0][0]
y_intercept = solution_eval[1][0]
print('slope: ' + str(slope))
print('y'_intercept: ' + str(y_intercept))
slope: 0.956117676145
y_intercept: 0.136575513864
best_fit = []
for i in x_vals:
best_fit.append(slope*i+y_intercept)
plt.plot(x_vals, y_vals, 'o', label='Data')
plt.plot(x_vals, best_fit, 'r-', label='Best' fit line', linewidth=3)
plt.legend(loc='upper left')
plt.show()[/mw_shl_code]
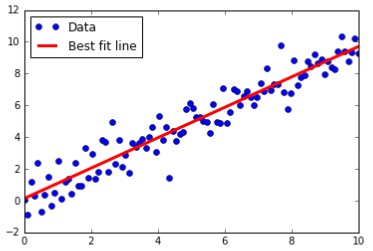
图2:通过乔列斯基分解获得的数据点和最佳拟合线。
怎么运行的…
正如你所看到的,我们得出了与之前的配方非常相似的答案。 请记住,这种分解矩阵的方式,然后对碎片执行我们的操作,有时效率更高,数值更稳定。
学习线性回归的张量流法
准备好
在这个配方中,我们将循环成批的数据点,并让TensorFlow更新斜率和Y轴截距。 我们将使用内置于Scikit Learn的虹膜数据集,而不是生成的数据。 具体而言,我们将通过数据点找到一条最佳线,其中x值是花瓣宽度,y值是萼片长度。 我们选择这两个因为它们之间似乎存在线性关系,我们将在最后的图表中看到。 我们还会在下一节讨论更多关于不同损失函数的影响,但是对于这个配方我们将使用L2损失函数。
怎么做…
1.我们首先加载必要的库,创建一个图并加载数据:
[mw_shl_code=python,true]import matplotlib.pyplot as plt
import numpy as np
import tensorflow as tf
from sklearn import datasets
from tensorflow.python.framework import ops
ops.reset_default_graph()
sess = tf.Session()
iris = datasets.load_iris()
x_vals = np.array([x[3] for x in iris.data])
y_vals = np.array([y[0] for y in iris.data])
2. We then declare our learning rate, batch size, placeholders, and model variables:
learning_rate = 0.05
batch_size = 25
x_data = tf.placeholder(shape=[None, 1], dtype=tf.float32)
y_target = tf.placeholder(shape=[None, 1], dtype=tf.float32)
A = tf.Variable(tf.random_normal(shape=[1,1]))
b = tf.Variable(tf.random_normal(shape=[1,1]))[/mw_shl_code]
2.接下来,我们写出线性模型的公式,y = Ax + b:
[mw_shl_code=python,true]model_output = tf.add(tf.matmul(x_data, A), b) [/mw_shl_code]
3.然后我们声明我们的L2损失函数(包括批处理的平均值),初始化变量并声明我们的优化器。 请注意,我们选择0.05作为学习率:
[mw_shl_code=python,true]loss = tf.reduce_mean(tf.square(y_target - model_output))
init = tf.global_variables_initializer()
sess.run(init)
my_opt = tf.train.GradientDescentOptimizer(learning_rate)
train_step = my_opt.minimize(loss) [/mw_shl_code]
4.我们现在可以在随机选择的批次上循环并训练模型。 我们将运行它100个循环,并每25次迭代打印一次变量和损失值。 请注意,这里我们还保存了每次迭代的损失,以便以后查看它们:
[mw_shl_code=python,true]loss_vec = []
for i in range(100):
rand_index = np.random.choice(len(x_vals), size=batch_size)
rand_x = np.transpose([x_vals[rand_index]])
rand_y = np.transpose([y_vals[rand_index]])
sess.run(train_step, feed_dict={x_data: rand_x, y_target: rand_y})
temp_loss = sess.run(loss, feed_dict={x_data: rand_x, y_ target: rand_y})
loss_vec.append(temp_loss)
if (i+1)%25==0:
print('Step #' + str(i+1) + ' A = ' + str(sess.run(A)) + ' b = ' + str(sess.run(b)))
print('Loss = ''' + str(temp_loss))
Step #25 A = [[ 2.17270374]] b = [[ 2.85338426]]
Loss = 1.08116
Step #50 A = [[ 1.70683455]] b = [[ 3.59916329]]
Loss = 0.796941
Step #75 A = [[ 1.32762754]] b = [[ 4.08189011]]
Loss = 0.466912
Step #100 A = [[ 1.15968263]] b = [[ 4.38497639]]
Loss = 0.281003[/mw_shl_code]
5. 接下来,我们将提取我们找到的系数,并创建一个最适合的线条放入图表中:
[mw_shl_code=python,true][slope] = sess.run(A)
[y_intercept] = sess.run(b)
best_fit = []
for i in x_vals:
best_fit.append(slope*i+y_intercept)[/mw_shl_code]
6. 这里我们将创建两个地块。 第一个是覆盖找到的行的数据。 第二个是100次迭代中的L2损失函数:
[mw_shl_code=python,true]plt.plot(x_vals, y_vals, 'o', label='Data Points')
plt.plot(x_vals, best_fit, 'r-', label='Best' fit line', linewidth=3)
plt.legend(loc='upper left')
plt.title('Sepal' Length vs Pedal Width')
plt.xlabel('Pedal Width')
plt.ylabel('Sepal Length')
plt.show()
plt.plot(loss_vec, 'k-')
plt.title('L2' Loss per Generation')
plt.xlabel('Generation')
plt.ylabel('L2 Loss')
plt.show()[/mw_shl_code]
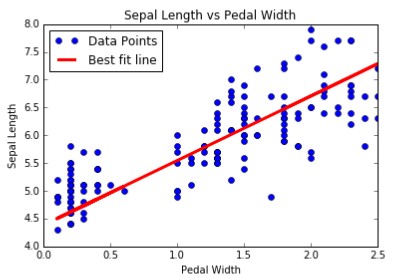
图3:这些是来自虹膜数据集(萼片长度与踏板宽度)的数据点,并与TensorFlow中使用指定算法找到的最佳线拟合相重叠。
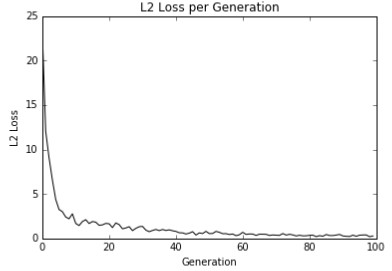
图4:这是用我们的算法拟合数据的L2损失。 请注意丢失功能中的抖动; 这可以随着批量的增大而减小或者随着批量减小而增加。
这里有一个很好的地方可以说明如何查看模型是否过度或不足。 如果我们的数据被分解为一个测试和训练集,并且测试集上的训练集精度更高,那么我们就会过度拟合数据。 如果测试和训练集的准确性仍然在增加,那么模型不适合,我们应该继续训练。
怎么运行的…
找到的最佳线不能保证是最合适的线。 收敛到最佳拟合线取决于迭代次数,批次大小,学习速率和丢失函数。 随着时间的推移观察损失函数总是很好的做法,因为它可以帮助我们解决问题或超参数更改。
原文:
Linear Regression
In this chapter, we will cover the basic recipes for understanding how TensorFlow works and how to access data for this book and additional resources. We will cover the following areas:
Using the Matrix Inverse Method
Implementing a Decomposition Method
Learning the TensorFlow Way of Regression
Understanding Loss Functions in Linear Regression
Implementing Deming Regression
Implementing Lasso and Ridge Regression
Implementing Elastic Net Regression
Implementing Regression Logistic Regression
Introduction
Linear regression may be one of the most important algorithms in statistics, machine learning, and science in general. It's one of the most used algorithms and it is very important to understand how to implement it and its various flavors. One of the advantages that linear regression has over many other algorithms is that it is very interpretable. We end up with a number for each feature that directly represents how that feature influences the target or dependent variable. In this chapter, we will introduce how linear regression can be classically implemented, and then move on to how to best implement it in TensorFlow. Remember that all the code is available at GitHub online at https://github.com/nfmcclure/ tensorflow_cookbook.
Using the Matrix Inverse Method
In this recipe, we will use TensorFlow to solve two dimensional linear regressions with the matrix inverse method.
Getting ready
Linear regression can be represented as a set of matrix equations, say . Here we are interested in solving the coefficients in matrix x. We have to be careful if our observation matrix (design matrix) A is not square. The solution to solving x can be expressed as . To show this is indeed the case, we will generate two-dimensional data, solve it in TensorFlow, and plot the result.
How to do it…
1.First we load the necessary libraries, initialize the graph, and create the data, as follows:
import matplotlib.pyplot as plt
import numpy as np
import tensorflow as tf
sess = tf.Session()
x_vals = np.linspace(0, 10, 100)
y_vals = x_vals + np.random.normal(0, 1, 100)
2.Next we create the matrices to use in the inverse method. We create the A matrix first, which will be a column of x-data and a column of 1s. Then we create the b matrix from the y-data. Use the following code:
x_vals_column = np.transpose(np.matrix(x_vals))
ones_column = np.transpose(np.matrix(np.repeat(1, 100)))
A = np.column_stack((x_vals_column, ones_column))
b = np.transpose(np.matrix(y_vals))
3.We then turn our A and b matrices into tensors, as follows:
A_tensor = tf.constant(A)
b_tensor = tf.constant(b)
4.Now that we have our matrices set up , we can use TensorFlow to solve this via the matrix inverse method, as follows:
tA_A = tf.matmul(tf.transpose(A_tensor), A_tensor)
tA_A_inv = tf.matrix_inverse(tA_A)
product = tf.matmul(tA_A_inv, tf.transpose(A_tensor))
solution = tf.matmul(product, b_tensor)
solution_eval = sess.run(solution)
5.We now extract the coefficients from the solution, the slope and the y-intercept, as follows:
slope = solution_eval[0][0]
y_intercept = solution_eval[1][0]
print('slope: ' + str(slope))
print('y'_intercept: ' + str(y_intercept))
slope: 0.955707151739
y_intercept: 0.174366829314
best_fit = []
for i in x_vals:
best_fit.append(slope*i+y_intercept)
plt.plot(x_vals, y_vals, 'o', label='Data')
plt.plot(x_vals, best_fit, 'r-', label='Best' fit line', linewidth=3)
plt.legend(loc='upper left')
plt.show()
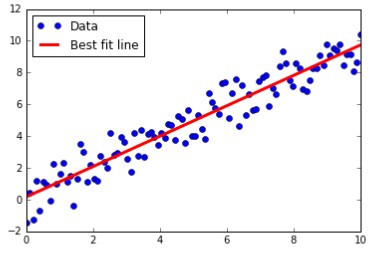
Figure 1: Data points and a best-fit line obtained via the matrix inverse method.
How it works…
Unlike prior recipes, or most recipes in this book, the solution here is found exactly through matrix operations. Most TensorFlow algorithms that we will use are implemented via a training loop and take advantage of automatic back propagation to update model variables. Here, we illustrate the versatility of TensorFlow by implementing a direct solution to fitting a model to data.
Implementing a Decomposition Method
For this recipe, we will implement a matrix decomposition method for linear regression. Specifically we will use the Cholesky decomposition, for which relevant functions exist in TensorFlow.
Getting ready
Implementing inverse methods in the previous recipe can be numerically inefficient in most cases, especially when the matrices get very large. Another approach is to decompose the A matrix and perform matrix operations on the decompositions instead. One such approach is to use the built-in Cholesky decomposition method in TensorFlow. One reason people are so interested in decomposing a matrix into more matrices is because the resulting matrices will have assured properties that allow us to use certain methods efficiently. The Cholesky decomposition decomposes a matrix into a lower and upper triangular matrix, say
 , such that these matrices are transpositions of each other. For further information on the properties of this decomposition, there are many resources available that describe it and how to arrive at it. Here we will solve the system,

 to arrive at our coefficient matrix, x.
How to do it…
1.We will set up the system exactly in the same way as the previous recipe. We will import libraries, initialize the graph, and create the data. Then we will obtain our A matrix and b matrix in the same way as before:
import matplotlib.pyplot as plt
import numpy as np
import tensorflow as tf
from tensorflow.python.framework import ops
ops.reset_default_graph()
sess = tf.Session()
x_vals = np.linspace(0, 10, 100)
y_vals = x_vals + np.random.normal(0, 1, 100)
x_vals_column = np.transpose(np.matrix(x_vals))
ones_column = np.transpose(np.matrix(np.repeat(1, 100)))
A = np.column_stack((x_vals_column, ones_column))
b = np.transpose(np.matrix(y_vals))
A_tensor = tf.constant(A)
b_tensor = tf.constant(b)
2.Next we will find the Cholesky decomposition of our square matrix,

Note that the TensorFlow function, cholesky(), only returns the lower diagonal part of the decomposition. This is fine, as the upper diagonal matrix is just the lower one, transposed.
tA_A = tf.matmul(tf.transpose(A_tensor), A_tensor)
L = tf.cholesky(tA_A)
tA_b = tf.matmul(tf.transpose(A_tensor), b)
sol1 = tf.matrix_solve(L, tA_b)
sol2 = tf.matrix_solve(tf.transpose(L), sol1)
3.Now that we have the solution, we extract the coefficients:
solution_eval = sess.run(sol2)
slope = solution_eval[0][0]
y_intercept = solution_eval[1][0]
print('slope: ' + str(slope))
print('y'_intercept: ' + str(y_intercept))
slope: 0.956117676145
y_intercept: 0.136575513864
best_fit = []
for i in x_vals:
best_fit.append(slope*i+y_intercept)
plt.plot(x_vals, y_vals, 'o', label='Data')
plt.plot(x_vals, best_fit, 'r-', label='Best' fit line', linewidth=3)
plt.legend(loc='upper left')
plt.show()
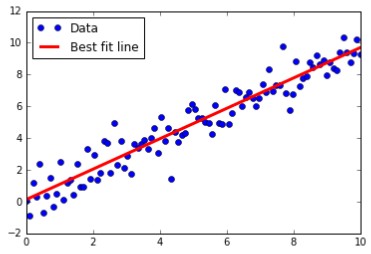
Figure 2: Data points and best-fit line obtained via Cholesky decomposition.
How it works…
As you can see, we arrive at a very similar answer to the prior recipe. Keep in mind that this
way of decomposing a matrix, then performing our operations on the pieces, is sometimes
much more efficient and numerically stable.
Learning The TensorFlow Way of Linear Regression
Getting ready
In this recipe, we will loop through batches of data points and let TensorFlow update the slope and y-intercept. Instead of generated data, we will us the iris dataset that is built in to the Scikit Learn. Specifically, we will find an optimal line through data points where the x-value is the petal width and the y-value is the sepal length. We choose these two because there appears to be a linear relationship between them, as we will see in the graphs at the end. We will also talk more about the effects of different loss functions in the next section, but for this recipe we will use the L2 loss function.
How to do it…
1. We start by loading the necessary libraries, creating a graph, and loading the data:
import matplotlib.pyplot as plt
import numpy as np
import tensorflow as tf
from sklearn import datasets
from tensorflow.python.framework import ops
ops.reset_default_graph()
sess = tf.Session()
iris = datasets.load_iris()
x_vals = np.array([x[3] for x in iris.data])
y_vals = np.array([y[0] for y in iris.data])
2. We then declare our learning rate, batch size, placeholders, and model variables:
learning_rate = 0.05
batch_size = 25
x_data = tf.placeholder(shape=[None, 1], dtype=tf.float32)
y_target = tf.placeholder(shape=[None, 1], dtype=tf.float32)
A = tf.Variable(tf.random_normal(shape=[1,1]))
b = tf.Variable(tf.random_normal(shape=[1,1]))
2.Next, we write the formula for the linear model, y=Ax+b:
model_output = tf.add(tf.matmul(x_data, A), b)
3.Then we declare our L2 loss function (which includes the mean over the batch), initialize the variables, and declare our optimizer. Note that we chose 0.05 as our learning rate:
loss = tf.reduce_mean(tf.square(y_target - model_output))
init = tf.global_variables_initializer()
sess.run(init)
my_opt = tf.train.GradientDescentOptimizer(learning_rate)
train_step = my_opt.minimize(loss)
4.We can now loop through and train the model on randomly selected batches. We will run it for 100 loops and print out the variable and loss values every 25 iterations. Note that here we are also saving the loss of every iteration so that we can view it afterwards:
loss_vec = []
for i in range(100):
rand_index = np.random.choice(len(x_vals), size=batch_size)
rand_x = np.transpose([x_vals[rand_index]])
rand_y = np.transpose([y_vals[rand_index]])
sess.run(train_step, feed_dict={x_data: rand_x, y_target: rand_y})
temp_loss = sess.run(loss, feed_dict={x_data: rand_x, y_ target: rand_y})
loss_vec.append(temp_loss)
if (i+1)%25==0:
print('Step #' + str(i+1) + ' A = ' + str(sess.run(A)) + ' b = ' + str(sess.run(b)))
print('Loss = ''' + str(temp_loss))
Step #25 A = [[ 2.17270374]] b = [[ 2.85338426]]
Loss = 1.08116
Step #50 A = [[ 1.70683455]] b = [[ 3.59916329]]
Loss = 0.796941
Step #75 A = [[ 1.32762754]] b = [[ 4.08189011]]
Loss = 0.466912
Step #100 A = [[ 1.15968263]] b = [[ 4.38497639]]
Loss = 0.281003
5.Next we will extract the coefficients we found and create a best-fit line to put in the graph:
[slope] = sess.run(A)
[y_intercept] = sess.run(b)
best_fit = []
for i in x_vals:
best_fit.append(slope*i+y_intercept)
6.Here we will create two plots. The first will be the data with the found line overlaid. The second is the L2 loss function over the 100 iterations:
plt.plot(x_vals, y_vals, 'o', label='Data Points')
plt.plot(x_vals, best_fit, 'r-', label='Best' fit line', linewidth=3)
plt.legend(loc='upper left')
plt.title('Sepal' Length vs Pedal Width')
plt.xlabel('Pedal Width')
plt.ylabel('Sepal Length')
plt.show()
plt.plot(loss_vec, 'k-')
plt.title('L2' Loss per Generation')
plt.xlabel('Generation')
plt.ylabel('L2 Loss')
plt.show()
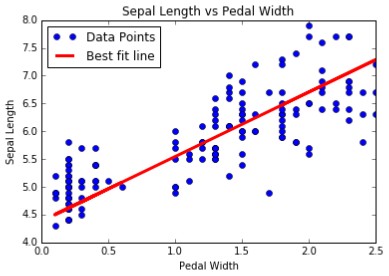
Figure 3: These are the data points from the iris dataset (sepal length versus pedal width) overlaid with the optimal line fit found in TensorFlow with the specified algorithm.
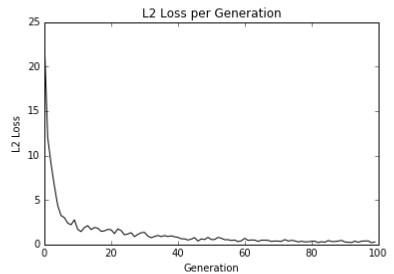
Figure 4: Here is the L2 loss of fitting the data with our algorithm. Note the jitter in the loss function; this can be decreased with a larger batch size or increased with a smaller batch size.
Here is a good place to note how to see if the model is over-or underfitting the data. If our data is broken into a test and train set, and the accuracy is greater on the train set and going down on the test set, then we are overfitting the data. If the accuracy is still increasing on both the test and train set, then the model is underfitting and we should continue training.
How it works…
The optimal line found is not guaranteed to be the best-fit line. Convergence to the best-fit line depends on the number of iterations, batch size, learning rate, and the loss function. It is always good practice to observe the loss function over time as it can help us troubleshoot problems or hyperparameter changes.
|
 /2
/2 