本帖最后由 PeersLee 于 2016-4-28 13:52 编辑
问题导读:
1.如何对类似电影评分数据进行切片切块用来满足实际需求?
2.如何通过对 1880-2010 年间全美婴儿的姓名来分析命名趋势?

解决方案:
数据下载:http://github.com/pydata/pydata-book
使用python 对MovieLens 用户提供的电影评分数据进行切片切块:
该数据集含有来自6000名用户对4000部电影的100万条评分数据。分为3个表:评分、用户信息、电影信息。
分别读取3张表中的数据:
- 我们可以用pandas.read_table()读入文本文件,返回一个DataFrame对象。read_table()会自动将第一行当作列名,对每行以制表符进行分割。
DataFrame对象是整个Pandas库中最核心、常用的类型,它与数据库或者Excel中的表格类似。由于数据很长,我们通过DataFrame.head()返回其头5行数据。在IPython Notebook中,DataFrame对象会以表格形式输出。 - 参数解释:
(1)sep:分隔符。
(2)header:None 读取到的数据直接放在表中,第一行不作为列名, 0 读取到的第一行作为列名,默认为0。
(3)names:列名列表。
原始数据:
[mw_shl_code=bash,true]peerslee@peerslee-ubuntu:~/workspace/py/pydata-book-master/ch02/movielens$ cat users.dat | head -n 10
1::F::1::10::48067
2::M::56::16::70072
3::M::25::15::55117
4::M::45::7::02460
5::M::25::20::55455
6::F::50::9::55117
7::M::35::1::06810
8::M::25::12::11413
9::M::25::17::61614
10::F::35::1::95370
[/mw_shl_code]
使用python 读取数据:
[mw_shl_code=bash,true]In [56]: unames = ['user_id', 'gender', 'age', 'occupation', 'zip']
In [57]: users = pd.read_table('users.dat', sep='::', header=None, names=unames)
In [58]: users.head()
Out[58]:
user_id gender age occupation zip
0 1 F 1 10 48067
1 2 M 56 16 70072
2 3 M 25 15 55117
3 4 M 45 7 02460
4 5 M 25 20 55455
[/mw_shl_code]
剩下的两张表使用一样的方式读取:
[mw_shl_code=bash,true]In [73]: rnames = ['user_id', 'movie_id', 'rating', 'timestamp']
In [74]: ratings = pd.read_table('ratings.dat', sep='::', header=None, names=rnames)
In [75]: ratings.head()Out[75]:
user_id movie_id rating timestamp
0 1 1193 5 978300760
1 1 661 3 978302109
2 1 914 3 978301968
3 1 3408 4 978300275
4 1 2355 5 978824291
In [76]: mnames = ['movie_id', 'title', 'genres']
In [77]: movies = pd.read_table('movies.dat', sep="::", header=None, names=mnames)
In [78]: movies.head()
Out[78]:
movie_id title genres
0 1 Toy Story (1995) Animation|Children's|Comedy
1 2 Jumanji (1995) Adventure|Children's|Fantasy
2 3 Grumpier Old Men (1995) Comedy|Romance
3 4 Waiting to Exhale (1995) Comedy|Drama
4 5 Father of the Bride Part II (1995) Comedy
[/mw_shl_code]
补充点知识:
- 首先DataFrame的某列可以通过DataFrame的下标操作获取,它得到的是一个Series对象:
- Series是一个一维的类似的数组对象,包含一个数组的数据(任何NumPy的数据类型)和一个与数组关联的数据标签,被叫做 索引 。最简单的Series是由一个数组的数据构成:
- Series是一个定长的,有序的字典,因为它把索引和值映射起来了
[mw_shl_code=bash,true]In [60]: users['age'].head()
Out[60]:
0 1
1 56
2 25
3 45
4 25
Name: age, dtype: int64
[/mw_shl_code]
将读取到的几张表合并在一起:
[mw_shl_code=bash,true]In [79]: data01 = pd.merge(ratings,users)
In [80]: data = pd.merge(data01,movies)
In [81]: data.head()
Out[81]:
user_id movie_id rating timestamp gender age occupation zip \
0 1 1193 5 978300760 F 1 10 48067
1 2 1193 5 978298413 M 56 16 70072
2 12 1193 4 978220179 M 25 12 32793
3 15 1193 4 978199279 M 25 7 22903
4 17 1193 5 978158471 M 50 1 95350
title genres
0 One Flew Over the Cuckoo's Nest (1975) Drama
1 One Flew Over the Cuckoo's Nest (1975) Drama
2 One Flew Over the Cuckoo's Nest (1975) Drama
3 One Flew Over the Cuckoo's Nest (1975) Drama
4 One Flew Over the Cuckoo's Nest (1975) Drama
[/mw_shl_code]
使用pivot_table 按性别计算每一部电影的平均得分:
[mw_shl_code=bash,true]In [27]: arr
array([[1, 1, 1],
[2, 2, 2],
[3, 3, 3]])
In [28]: np.sum(arr)
Out[28]: 18
In [29]: np.sum(arr,axis=0)
Out[29]: array([6, 6, 6])
In [30]: np.sum(arr,axis=1)
Out[30]: array([3, 6, 9])
In [31]: np.sum(arr,axis=-1)
Out[31]: array([3, 6, 9])
Out[33]:
array([[1, 1, 1],
[2, 2, 2],
[3, 3, 3]])
In [34]: np.mean(arr)
Out[34]: 2.0
In [35]: np.mean(arr,axis=0)
Out[35]: array([ 2., 2., 2.])
In [36]: np.mean(arr,axis=1)
Out[36]: array([ 1., 2., 3.])
In [37]: np.var(arr)
Out[37]: 0.66666666666666663
In [38]: np.std(arr)
Out[38]: 0.81649658092772603
[/mw_shl_code]
电影平均得分的DataFrame,行标为电影名称,列标为性别:
[mw_shl_code=bash,true]In [92]: mean_rating = pd.pivot_table(data,index="title",columns="gender", values="rating",aggfunc=np.mean)
In [93]: mean_rating.head()
Out[93]:
gender F M
title
$1,000,000 Duck (1971) 3.375000 2.761905
'Night Mother (1986) 3.388889 3.352941
'Til There Was You (1997) 2.675676 2.733333
'burbs, The (1989) 2.793478 2.962085
...And Justice for All (1979) 3.828571 3.689024
[/mw_shl_code]
过滤掉评分数据不够300条的电影:
- 对title进行分组,然后利用size()得到一个含有各电影分组大小的Series对象:
[mw_shl_code=bash,true]In [100]: ratings_by_title = data.groupby('title').size()
In [101]: ratings_by_title.head()
Out[101]:
title
$1,000,000 Duck (1971) 37
'Night Mother (1986) 70
'Til There Was You (1997) 52
'burbs, The (1989) 303
...And Justice for All (1979) 199
dtype: int64
In [102]: active_title = ratings_by_title.index[ratings_by_title >= 300]
[/mw_shl_code]
另外一个特别之处在于 DataFrame 对象的索引方式,因为他有两个轴向(双重索引)。 可以这么理解:DataFrame 对象的标准切片语法为:.ix[::,::]。ix 对象可以接受两套切片,分别为行(axis=0)和列(axis=1)的方向
[mw_shl_code=bash,true]In [112]: mean_rating = mean_rating.ix[active_title]
In [113]: mean_rating.head()
Out[113]:
gender F M
title
'burbs, The (1989) 2.793478 2.962085
10 Things I Hate About You (1999) 3.646552 3.311966
101 Dalmatians (1961) 3.791444 3.500000
101 Dalmatians (1996) 3.240000 2.911215
12 Angry Men (1957) 4.184397 4.328421
[/mw_shl_code]
了解女性观众最喜欢的电影:
- Series 的 sort_index(ascending=True) 方法可以对 index 进行排序操作,ascending 参数用于控制升序或降序,默认为升序。
若要按值对 Series 进行排序,当使用 .order(na_last=True, ascending=True, kind='mergesort') 方法,任何缺失值默认都会被放到 Series 的末尾。 - DataFrame 的 sort_index(axis=0, by=None, ascending=True) 方法多了一个轴向的选择参数与一个 by 参数,by 参数的作用是针对某一(些)列进行排序(不能对行使用 by 参数)
[mw_shl_code=bash,true]In [114]: top_female_rating = mean_rating.sort_index(by='F', ascending=False)
In [115]: top_female_rating.head()
Out[115]:
gender F M
title
Close Shave, A (1995) 4.644444 4.473795
Wrong Trousers, The (1993) 4.588235 4.478261
Sunset Blvd. (a.k.a. Sunset Boulevard) (1950) 4.572650 4.464589
Wallace & Gromit: The Best of Aardman Animation (1996) 4.563107 4.385075
Schindler's List (1993) 4.562602 4.491415
[/mw_shl_code]
计算评分分歧:
- 要求出男性与女性观众分歧最大的电影,可以在 mean_rating 加上一个用于存放平均得分之差的列,并对其进行排序:
[mw_shl_code=bash,true]In [116]: mean_rating['diff'] = mean_rating['M'] - mean_rating['F']
In [117]: sorted_by_diff = mean_rating.sort_index(by='diff')
In [118]: sorted_by_diff.head()
Out[118]:
gender F M diff
title
Dirty Dancing (1987) 3.790378 2.959596 -0.830782
Jumpin' Jack Flash (1986) 3.254717 2.578358 -0.676359
Grease (1978) 3.975265 3.367041 -0.608224
Steel Magnolias (1989) 3.901734 3.365957 -0.535777
Anastasia (1997) 3.800000 3.281609 -0.518391
[/mw_shl_code]
[mw_shl_code=bash,true]In [125]: sorted_by_diff[::-1].head()
Out[125]:
gender F M diff
title
Good, The Bad and The Ugly, The (1966) 3.494949 4.221300 0.726351
Kentucky Fried Movie, The (1977) 2.878788 3.555147 0.676359
Dumb & Dumber (1994) 2.697987 3.336595 0.638608
Longest Day, The (1962) 3.411765 4.031447 0.619682
Cable Guy, The (1996) 2.250000 2.863787 0.613787[/mw_shl_code]
- 利用方差或标准差找出分歧最大的电影(不考虑性别因素):
(1)得到一个 根据电影名称分组的得分数据标准差 的Series
(2)根据active_titles 进行过滤
(3)根据值对Series 进行降序排列
[mw_shl_code=bash,true]In [134]: rating_std_by_title = data.groupby('title')['rating'].std()
In [135]: rating_std_by_title = rating_std_by_title.ix[active_title]
In [136]: rating_std_by_title.order(ascending=False).head()
Out[136]:
title
Dumb & Dumber (1994) 1.321333
Blair Witch Project, The (1999) 1.316368
Natural Born Killers (1994) 1.307198
Tank Girl (1995) 1.277695
Rocky Horror Picture Show, The (1975) 1.260177
Name: rating, dtype: float64
[/mw_shl_code]
根据1880-2010年间全美婴儿姓名来分析命名趋势:
- read_csv 就是 read_table 的 sep=','
[mw_shl_code=bash,true]In [34]: import pandas as pd
In [35]: names1880 = pd.read_csv('yob1880.txt', names=['name', 'sex', 'births'])
In [38]: names1880.head()
Out[38]:
name sex births
0 Mary F 7065
1 Anna F 2604
2 Emma F 2003
3 Elizabeth F 1939
4 Minnie F 1746
[/mw_shl_code]
- 对names1880 中男孩和女孩分别求出 births总和
[mw_shl_code=bash,true]In [41]: names1880.groupby('sex').births.sum()
Out[41]:
sex
F 90993
M 110493
Name: births, dtype: int64
[/mw_shl_code]
- 该数据集按年度被分隔成了多个文件,我们要将这些文件都装导一个DataFrame中里面,并加上一个year字段。
merge 算是一种整合的话,轴向连接 pd.concat() 就是单纯地把两个表拼在一起,这个过程也被称作连接(concatenation)、绑定(binding)或堆叠(stacking)。因此可以想见,这个函数的关键参数应该是 axis,用于指定连接的轴向。在默认的 axis=0 情况下,pd.concat([obj1,obj2]) 函数的效果与 obj1.append(obj2) 是相同的;而在 axis=1 的情况下,pd.concat([df1,df2],axis=1) 的效果与 pd.merge(df1,df2,left_index=True,right_index=True,how='outer') 是相同的。可以理解为 concat 函数使用索引作为“连接键”。 merge 列数增加; append行数增加
[mw_shl_code=python,true]#!/usr/bin/env python
# coding=utf-8
import pandas as pd
years = range(1880,2011)
pieces = []
columns = ['name', 'sex', 'births']
for year in years:
path = 'yob%d.txt' %year
frame = pd.read_csv(path, names = columns)
frame['year'] = year
pieces.append(frame)
names = pd.concat(pieces,ignore_index=True[/mw_shl_code]
[mw_shl_code=bash,true]In [39]: run name02.py
In [51]: names.head()
Out[51]:
name sex births year
0 Mary F 7065 1880
1 Anna F 2604 1880
2 Emma F 2003 1880
3 Elizabeth F 1939 1880
4 Minnie F 1746 1880
[/mw_shl_code]
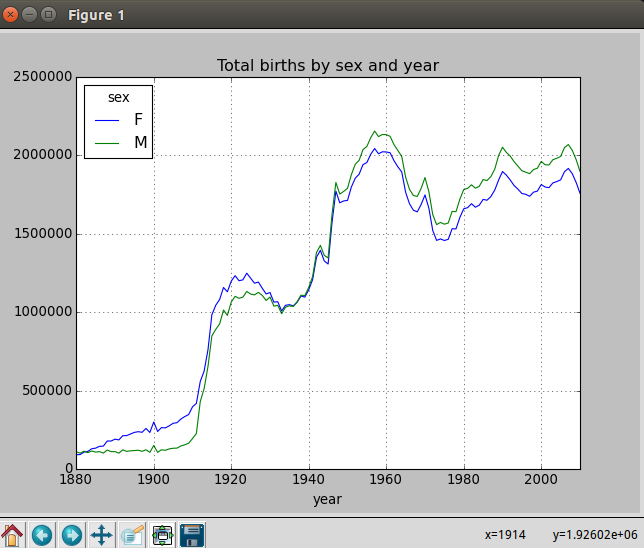
- 利用pivot_table 在year 和 sex 级别上对其进行聚合
[mw_shl_code=bash,true]In [52]: total_births = pd.pivot_table(names, index="year", columns="sex", values="births", aggfunc=sum)
In [53]: total_births.tail()
Out[53]:
sex F M
year
2006 1896468 2050234
2007 1916888 2069242
2008 1883645 2032310
2009 1827643 1973359
2010 1759010 1898382
In [54]: total_births.plot(title="Total births by sex and year")
[/mw_shl_code]

- 向数据集中添加一列 指定名字的婴儿占出生婴儿总数的百分比:
- (1)按照year 和 sex 分组
- (2)将新列添加到各个分组上
[mw_shl_code=python,true]#!/usr/bin/env python
# coding=utf-8
def add_prop(group):
births = group.births.astype(float)
group['prop'] = births / births.sum()
return group
[/mw_shl_code]
[mw_shl_code=bash,true]In [62]: names = names.groupby(['year', 'sex']).apply(add_prop)
In [63]: names.head()
Out[63]:
name sex births year prop
0 Mary F 7065 1880 0.077643
1 Anna F 2604 1880 0.028618
2 Emma F 2003 1880 0.022013
3 Elizabeth F 1939 1880 0.021309
4 Minnie F 1746 1880 0.019188
[/mw_shl_code]
- 利用np.allclose 来检查这个分组的值是否接近 1
[mw_shl_code=python,true]In [66]: np.allclose(names.groupby(['year','sex']).prop.sum(),1)
Out[66]: True
[/mw_shl_code]
[mw_shl_code=python,true]#!/usr/bin/env python
# coding=utf-8
def get_top1000(group):
return group.sort_index(by='births', ascending=False)[:1000]
[/mw_shl_code]
[mw_shl_code=bash,true]In [73]: run name03.py
In [74]: grouped = names.groupby(['year','sex'])
In [75]: top1000 = grouped.apply(get_top1000)
In [76]: top1000.head()
Out[76]:
name sex births year prop
year sex
1880 F 0 Mary F 7065 1880 0.077643
1 Anna F 2604 1880 0.028618
2 Emma F 2003 1880 0.022013
3 Elizabeth F 1939 1880 0.021309
4 Minnie F 1746 1880 0.019188
In [77]:
[/mw_shl_code]
分析命运趋势:
[mw_shl_code=python,true]In [30]: boys = top1000[top1000.sex == 'M']
In [31]: girls = top1000[top1000.sex == 'F']
[/mw_shl_code]
- 生成一张按照year 和 name 统计的总出生数透视图
[mw_shl_code=bash,true]In [33]: total_births = pd.pivot_table(top1000, index='year', columns='name',values='births',aggfunc=sum)
In [34]: total_births.head()
Out[34]:
name Aaden Aaliyah Aarav Aaron Aarush Abagail Abbey Abbie Abbigail \
year
1880 NaN NaN NaN 102 NaN NaN NaN 71 NaN
2010 448 4628 438 7374 226 277 295 324 585
name Abby ... Zion Zoa Zoe Zoey Zoie Zola Zona Zora Zula Zuri
year ...
1880 6 ... NaN 8 23 NaN NaN 7 8 28 27 NaN
2010 1140 ... 1926 NaN 6200 5164 504 NaN NaN NaN NaN 258
[2 rows x 3200 columns]
[/mw_shl_code]
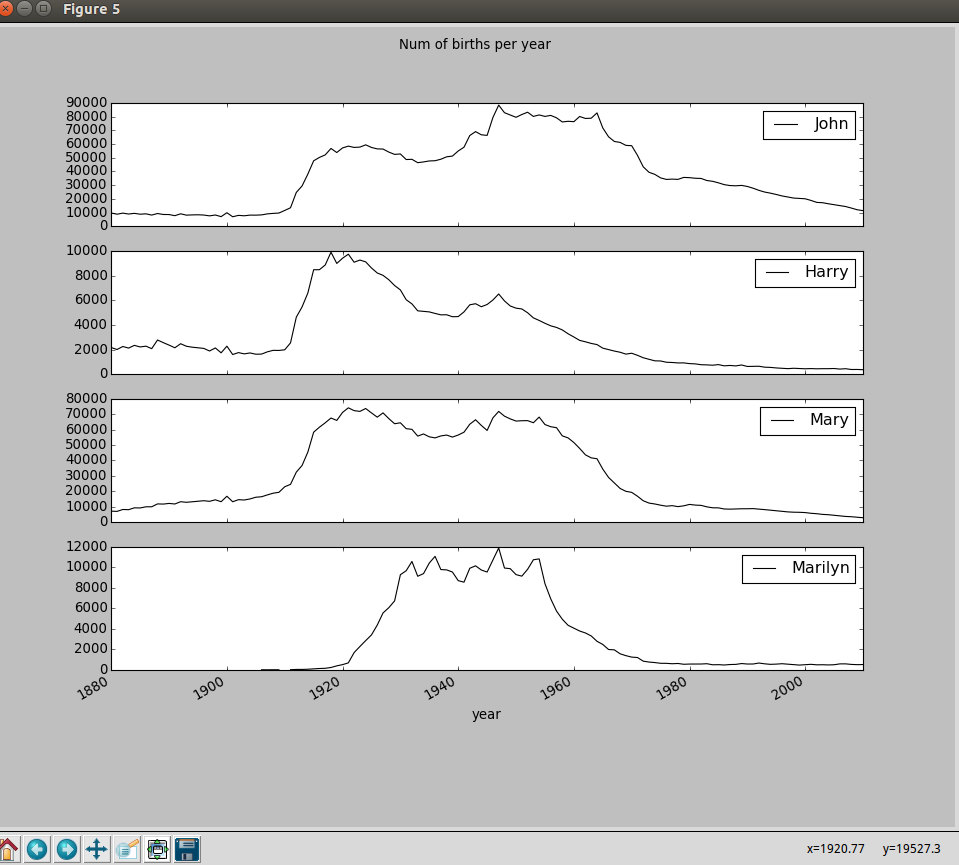
- 用DataFrame 的plot 方法绘制几个名字的曲线图:
(1)完整代码:
[mw_shl_code=python,true]#!/usr/bin/env python
# coding=utf-8
import pandas as pd
import numpy as np
# 整合数据
years = range(1880,2011)
pieces = []
columns = ['name', 'sex', 'births']
for year in years:
path = 'yob%d.txt' %year
frame = pd.read_csv(path, names = columns)
frame['year'] = year
pieces.append(frame)
names = pd.concat(pieces,ignore_index=True)
# 在year 和 sex 级别上聚合数据
total_births = pd.pivot_table(names, index='year', columns='sex', values='births', aggfunc=np.sum)
def add_prop(group):
births = group.births.astype(float)
group['prop'] = births / births.sum()
return group
names = names.groupby(['year','sex']).apply(add_prop)
def get_top1000(group):
return group.sort_index(by='births', ascending=False)[:1000]
grouped = names.groupby(['year','sex'])
top1000 = grouped.apply(get_top1000)
boys = top1000[top1000.sex == 'M']
girls = top1000[top1000.sex == 'F']
total_births = pd.pivot_table(top1000, index='year', columns='name', values='births',aggfunc=np.sum)
subset = total_births[['John','Harry','Mary','Marilyn']]
[/mw_shl_code]
(2)可视化:
[mw_shl_code=bash,true]In [102]: subset.plot(subplots=True, figsize=(12,10), grid=False, title="Num of births per year")
[/mw_shl_code]

评估命名多样性的增长:
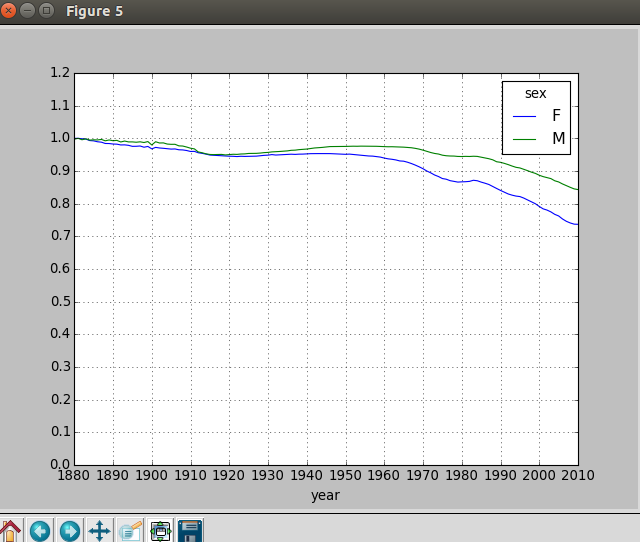
- 分性别 统计 起最流行的1000 个的名字的孩子占总人数中的比例:
[mw_shl_code=python,true]table = pd.pivot_table(
top1000,
index='year',
columns='sex',
values='prop',
aggfunc=np.sum)[/mw_shl_code]
[mw_shl_code=bash,true]In [116]: table.plot(yticks=np.linspace(0,1.2,13), xticks=range(1880,2020,10))[/mw_shl_code]

- 从上图可以知道名字的多样性出现了增长
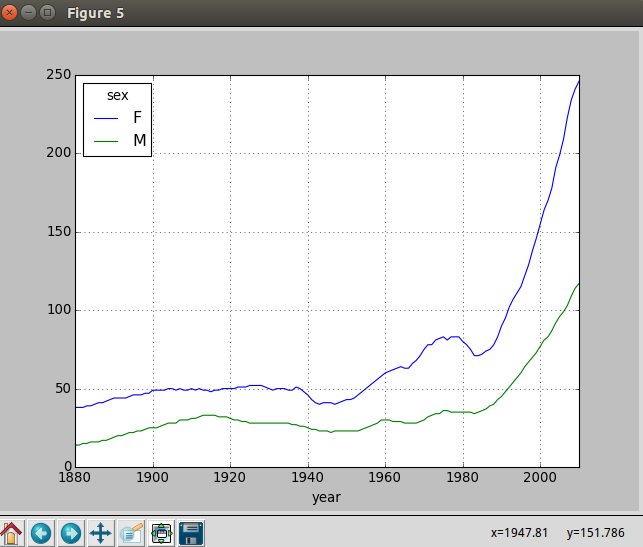
- 使用另一个方法:
(1)计算在2010年,占总人数前50%的不同名字的数量
(2)利用numpy 先计算prop 的累计和cumsum
(3)通过searchsorted方法找出0.5 应该被插入在那个位置才能保证不破坏顺序
- 塑层次化索引 - 层次化索引为 DataFrame 数据的重排任务提供了一种具有良好一致性的方式。重塑层次化索引通过以下两个方法完成:
- .stack() 将列 “压缩” 为行的下级层次化索引
- .unstack() stack 的逆操作——将层次化的行索引 “展开” 为列
[mw_shl_code=python,true]def get_quantile_count(group, q=0.5):
group = group.sort_index(by='prop', ascending=False)
return group.prop.cumsum().searchsorted(q) + 1
diversity = top1000.groupby(['year', 'sex']).apply(get_quantile_count)
diversity = diversity.unstack('sex')[/mw_shl_code]
[mw_shl_code=bash,true]In [141]: run names01.py
In [142]: diversity.head()
Out[142]:
sex F M
year
1880 [38] [14]
1881 [38] [14]
1882 [38] [15]
1883 [39] [15]
1884 [39] [16]
[/mw_shl_code]
[mw_shl_code=python,true]int(x [,base ]) 将x转换为一个整数
long(x [,base ]) 将x转换为一个长整数
float(x ) 将x转换到一个浮点数
complex(real [,imag ]) 创建一个复数
str(x ) 将对象 x 转换为字符串
repr(x ) 将对象 x 转换为表达式字符串
eval(str ) 用来计算在字符串中的有效Python表达式,并返回一个对象
tuple(s ) 将序列 s 转换为一个元组
list(s ) 将序列 s 转换为一个列表
chr(x ) 将一个整数转换为一个字符
unichr(x ) 将一个整数转换为Unicode字符
ord(x ) 将一个字符转换为它的整数值
hex(x ) 将一个整数转换为一个十六进制字符串
oct(x ) 将一个整数转换为一个八进制字符串 [/mw_shl_code]
[mw_shl_code=python,true]In [147]: run names01.py
In [148]: diversity.plot()
[/mw_shl_code]
Number of popular names in top 50%:

|
 /2
/2 