本帖最后由 levycui 于 2018-3-15 11:29 编辑
问题导读:
1、如何使用随机训练进行批量训练?
2、如何计算批次中每个数据点的L2损失的平均值?
3、如何使用代码绘制批量损失?
4、如何在虹膜数据上实现分类器?

上一篇:TensorFlow ML cookbook 第二章5节 实施向后传播
使用批次和随机训练
虽然TensorFlow根据之前描述的反向传播更新我们的模型变量,但它可以在一次数据观察到大量数据的任何地方运行。 在一个训练样例上运行可能会导致非常不稳定的学习过程,而使用过大的批次可能在计算上花费很大。 选择正确的培训类型对于让我们的机器学习算法收敛到解决方案至关重要。
准备好
为了使TensorFlow能够计算反向传播的变量梯度,我们必须测量样本或多个样本的损失。 随机训练一次只进行一次随机抽样的数据 - 目标对,就像我们在前面的配方中一样。 另一种选择是一次放入大部分训练样例并平均计算梯度损失。 批量训练的大小可以随着整个数据集的不同而变化。 这里我们将展示如何扩展先验回归示例,该示例使用随机训练进行批量训练。
我们将首先加载numpy,matplotlib和tensorflow并开始一个图形会话,如下所示:
[mw_shl_code=python,true]import matplotlib as plt
import numpy as np
import tensorflow as tf
sess = tf.Session()[/mw_shl_code]
怎么做…
1.我们将首先声明批量大小。 这将是我们一次将通过计算图形提供多少个数据观察结果:
[mw_shl_code=python,true]batch_size = 20[/mw_shl_code]
2.接下来我们在模型中声明数据,占位符和变量。 我们在这里做的改变是改变占位符的形状。 它们现在是两个维度,第一个维度是无,第二个维度是批次中的数据点数量。 我们可以明确地将其设置为20,但我们可以概括并使用None值。 同样,如第1章TensorFlow入门所述,我们仍然必须确保这些维度在模型中生效,并且这不允许我们执行任何非法矩阵操作:
[mw_shl_code=python,true]x_vals = np.random.normal(1, 0.1, 100)
y_vals = np.repeat(10., 100)
x_data = tf.placeholder(shape=[None, 1], dtype=tf.float32)
y_target = tf.placeholder(shape=[None, 1], dtype=tf.float32)
A = tf.Variable(tf.random_normal(shape=[1,1])) [/mw_shl_code]
3. 现在我们将操作添加到图中,该图现在将是矩阵乘法而不是常规乘法。 请记住,矩阵乘法不是交流的,所以我们必须在matmul()函数中以正确的顺序输入矩阵:
[mw_shl_code=python,true]my_output = tf.matmul(x_data, A) [/mw_shl_code]
4.我们的损失函数将发生变化,因为我们必须计算批次中每个数据点的所有L2损失的平均值。 我们通过将我们先前的损失输出包装在TensorFlow的reduce_mean()函数中来做到这一点:
[mw_shl_code=python,true]loss = tf.reduce_mean(tf.square(my_output - y_target)) [/mw_shl_code]
5.我们宣布我们的优化器就像我们之前做的那样:
[mw_shl_code=python,true]my_opt = tf.train.GradientDescentOptimizer(0.02)
train_step = my_opt.minimize(loss) [/mw_shl_code]
6.最后,我们将遍历并迭代训练步骤以优化算法。 这部分与以前不同,因为我们希望能够绘制随机训练收敛与丢失。 所以我们初始化一个列表来存储每五个时间间隔的损失函数:
[mw_shl_code=python,true]loss_batch = []
for i in range(100):
rand_index = np.random.choice(100, size=batch_size)
rand_x = np.transpose([x_vals[rand_index]])
rand_y = np.transpose([y_vals[rand_index]])
sess.run(train_step, feed_dict={x_data: rand_x, y_target: rand_y})
if (i+1)%5==0:
print('Step #' + str(i+1) + ' A = ' + str(sess.run(A)))
temp_loss = sess.run(loss, feed_dict={x_data: rand_x, y_ target: rand_y})
print('Loss = ' + str(temp_loss))
loss_batch.append(temp_loss) [/mw_shl_code]
7. 这是100次迭代的最终结果。 请注意,A的值有一个额外的维度,因为它现在必须是一个2D矩阵:
[mw_shl_code=python,true]Step #100 A = [[ 9.86720943]]
Loss = 0. [/mw_shl_code]
怎么运行的…
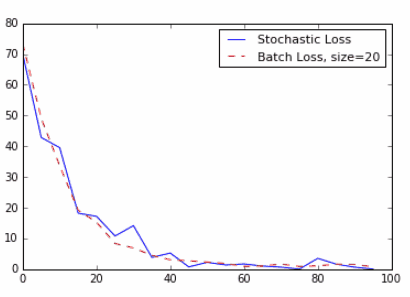
批次训练和随机训练在其优化方法及其收敛方面有所不同。 找到一个好的批量大小可能很困难。 要看批次和随机收敛程度的不同,下面是代码来绘制上面的批量损失。 这里还有一个包含随机损失的变量,但是这个计算是从本章的前一节开始的。 这里是保存和记录训练循环中随机丢失的代码。 只需在之前的配方中替换此代码即可:
[mw_shl_code=python,true]loss_stochastic = []
for i in range(100):
rand_index = np.random.choice(100)
rand_x = [x_vals[rand_index]]
rand_y = [y_vals[rand_index]]
sess.run(train_step, feed_dict={x_data: rand_x, y_target: rand_y})
if (i+1)%5==0:
print('Step #' + str(i+1) + ' A = ' + str(sess.run(A)))
temp_loss = sess.run(loss, feed_dict={x_data: rand_x, y_ target: rand_y})
print('Loss = ' + str(temp_loss))
loss_stochastic.append(temp_loss)[/mw_shl_code]
下面是为相同回归问题生成随机和批量损失图的代码:
[mw_shl_code=python,true]plt.plot(range(0, 100, 5), loss_stochastic, 'b-', label='Stochastic Loss')
plt.plot(range(0, 100, 5), loss_batch, 'r--', label='Batch' Loss, size=20')
plt.legend(loc='upper right', prop={'size': 11})
plt.show()[/mw_shl_code]

图6:随机损失和批量损失(批量大小= 20)绘制超过100次迭代。 请注意,批量损失更平稳,随机损失更不稳定。
还有更多…

把所有内容结合在一起
在本节中,我们将结合到目前为止所阐述的所有内容,并在虹膜数据集上创建一个分类器。
准备好
虹膜数据集在第1章TensorFlow入门使用数据源配方中有更详细的描述。 我们将加载这些数据,并做一个简单的二元分类器来预测一朵花是不是鸢尾属物种。 要清楚的是,这个数据集有三类物种,但我们只会预测它是否是一个物种(I. setosa),给我们一个二元分类器。 我们将首先加载库和数据,然后相应地转换目标。
怎么做…
1.首先我们加载需要的库并初始化计算图。 请注意,我们也在这里加载matplotlib,因为我们想在之后绘制结果行:
[mw_shl_code=python,true]import matplotlib.pyplot as plt
import numpy as np
from sklearn import datasets
import tensorflow as tf
sess = tf.Session() [/mw_shl_code]
2.接下来我们加载虹膜数据。 我们还需要将目标数据转换为1或0,如果目标是setosa或不。 由于虹膜数据集将setosa标记为零,因此我们将所有目标的值更改为0,其他值全部设为0.我们还将只使用两个特征,即花瓣长度和花瓣宽度。 这两个特征是每个x值中的第三个和第四个条目:
[mw_shl_code=python,true]iris = datasets.load_iris()
binary_target = np.array([1. if x==0 else 0. for x in iris. target])
iris_2d = np.array([[x[2], x[3]] for x in iris.data])
[/mw_shl_code]
3.让我们声明我们的批量大小,数据占位符和模型变量。 请记住,批量变量大小的数据占位符具有None作为第一维:
[mw_shl_code=python,true]batch_size = 20
x1_data = tf.placeholder(shape=[None, 1], dtype=tf.float32)
x2_data = tf.placeholder(shape=[None, 1], dtype=tf.float32)
y_target = tf.placeholder(shape=[None, 1], dtype=tf.float32)
A = tf.Variable(tf.random_normal(shape=[1, 1]))
b = tf.Variable(tf.random_normal(shape=[1, 1]))[/mw_shl_code]
4.这里我们定义线性模型。 该模型将采取x2 = x1 * A + b的形式。 如果我们想找到高于或低于该线的点,当插入等式x2-x1 * A-b时,我们会看到它们是高于还是低于零。 我们将通过采用该方程的S形并通过该方程预测1或0来做到这一点。 请记住,TensorFlow具有内置sigmoid的损失函数,所以我们只需要在sigmoid函数之前定义模型的输出:
[mw_shl_code=python,true]my_mult = tf.matmul(x2_data, A)
my_add = tf.add(my_mult, b)
my_output = tf.sub(x1_data, my_add) [/mw_shl_code]
5. 现在我们在TensorFlow的内置函数中添加我们的sigmoid交叉熵损失函数,
[mw_shl_code=python,true]sigmoid_cross_entropy_with_logits():
xentropy = tf.nn.sigmoid_cross_entropy_with_logits(my_output, y_ target) [/mw_shl_code]
6.我们还必须通过声明一个优化方法来告诉TensorFlow如何优化我们的计算图。 我们将要尽量减少交叉熵损失。 我们也会选择0.05作为我们的学习率:
[mw_shl_code=python,true]my_opt = tf.train.GradientDescentOptimizer(0.05)
train_step = my_opt.minimize(xentropy) [/mw_shl_code]
7.现在我们创建一个变量初始化操作并告诉TensorFlow执行它:
[mw_shl_code=python,true]init = tf.initialize_all_variables()
sess.run(init) [/mw_shl_code]
8.现在我们将用1000次迭代训练我们的线性模型。 我们将提供我们需要的三个数据点:花瓣长度,花瓣宽度和目标变量。 每200次迭代我们将打印变量值:
[mw_shl_code=python,true]for i in range(1000):
rand_index = np.random.choice(len(iris_2d), size=batch_size)
rand_x = iris_2d[rand_index]
rand_x1 = np.array([[x[0]] for x in rand_x])
rand_x2 = np.array([[x[1]] for x in rand_x])
rand_y = np.array([[y] for y in binary_target[rand_index]])
sess.run(train_step, feed_dict={x1_data: rand_x1, x2_data: rand_x2, y_target: rand_y})
if (i+1)%200==0:
print('Step #' + str(i+1) + ' A = ' + str(sess.run(A)) + ', b = ' + str(sess.run(b)))
Step #200 A = [[ 8.67285347]], b = [[-3.47147632]]
Step #400 A = [[ 10.25393486]], b = [[-4.62928772]]
Step #600 A = [[ 11.152668]], b = [[-5.4077611]]
Step #800 A = [[ 11.81016064]], b = [[-5.96689034]]
Step #1000 A = [[ 12.41202831]], b = [[-6.34769201]] [/mw_shl_code]
9.下一组命令提取模型变量,并在图形上绘制线条。 结果图在下一节中:
[mw_shl_code=python,true][[slope]] = sess.run(A)
[[intercept]] = sess.run(b)
x = np.linspace(0, 3, num=50)
ablineValues = []
for i in x:
ablineValues.append(slope*i+intercept)
setosa_x = [a[1] for i,a in enumerate(iris_2d) if binary_ target==1]
setosa_y = [a[0] for i,a in enumerate(iris_2d) if binary_ target==1]
non_setosa_x = [a[1] for i,a in enumerate(iris_2d) if binary_ target==0]
non_setosa_y = [a[0] for i,a in enumerate(iris_2d) if binary_ target==0]
plt.plot(setosa_x, setosa_y, 'rx', ms=10, mew=2, label='setosa''')
plt.plot(non_setosa_x, non_setosa_y, 'ro', label='Non-setosa')
plt.plot(x, ablineValues, 'b-')
plt.xlim([0.0, 2.7])
plt.ylim([0.0, 7.1])
plt.suptitle('Linear' Separator For I.setosa', fontsize=20)
plt.xlabel('Petal Length')
plt.ylabel('Petal Width')
plt.legend(loc='lower right')
plt.show()[/mw_shl_code]
怎么运行的…
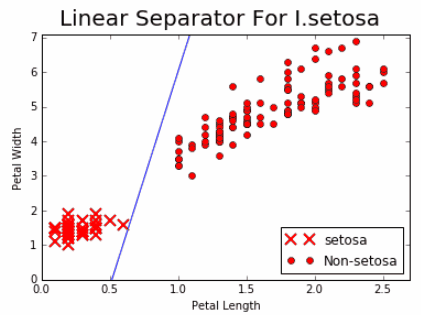
我们的目标是使用只有花瓣宽度和花瓣长度的I.setosa点和其他两个物种之间的一条线。 如果我们绘制点和结果线,我们看到我们已经实现了以下内容:

图7:花瓣宽度与花瓣长度相比, 实线是我们在1000次迭代后实现的线性分隔符。
还有更多…
虽然我们实现了将两个类别分开的目标,但它可能不是分离两个类别的最佳模型。 在第4章支持向量机中,我们将讨论支持向量机,它是在特征空间中分离两个类的更好方法。
也可以看看
有关虹膜数据集的更多信息,请参阅维基百科条目https://en.wikipedia. org/wiki/Iris_flower_data_set 有关Scikit Learn虹膜数据集实施的信息,请参阅http://scikit-learn.org/stable/auto_ examples/datasets/plot_iris_dataset.html.上的文档。
原文:
Working with Batch and Stochastic Training
While TensorFlow updates our model variables according to the prior described back propagation, it can operate on anywhere from one datum observation to a large group of data at once. Operating on one training example can make for a very erratic learning process, while using a too large batch can be computationally expensive. Choosing the right type of training is crucial to getting our machine learning algorithms to converge to a solution.
Getting ready
In order for TensorFlow to compute the variable gradients for back propagation to work, we have to measure the loss on a sample or multiple samples. Stochastic training is only putting through one randomly sampled data-target pair at a time, just like we did in the previous recipe. Another option is to put a larger portion of the training examples in at a time and average the loss for the gradient calculation. Batch training size can vary up to and including the whole dataset at once. Here we will show how to extend the prior regression example, which used stochastic training to batch training.
We will start by loading numpy, matplotlib, and tensorflow and start a graph session, as follows:
import matplotlib as plt
import numpy as np
import tensorflow as tf
sess = tf.Session()
How to do it…
1.We will start by declaring a batch size. This will be how many data observations we will feed through the computational graph at one time:
batch_size = 20
2.Next we declare the data, placeholders, and the variable in the model. The change we make here is tothat we change the shape of the placeholders. They are now two dimensions, where the first dimension is None, and second will be the number of data points in the batch. We could have explicitly set it to 20, but we can generalize and use the None value. Again, as mentioned in Chapter 1, Getting Started with TensorFlow, we still have to make sure that the dimensions work out in the model and this does not allow us to perform any illegal matrix operations:
x_vals = np.random.normal(1, 0.1, 100)
y_vals = np.repeat(10., 100)
x_data = tf.placeholder(shape=[None, 1], dtype=tf.float32)
y_target = tf.placeholder(shape=[None, 1], dtype=tf.float32)
A = tf.Variable(tf.random_normal(shape=[1,1]))
3.Now we add our operation to the graph, which will now be matrix multiplication instead of regular multiplication. Remember that matrix multiplication is not communicative so we have to enter the matrices in the correct order in the matmul() function:
my_output = tf.matmul(x_data, A)
4.Our loss function will change because we have to take the mean of all the L2 losses of each data point in the batch. We do this by wrapping our prior loss output in TensorFlow's reduce_mean() function:
loss = tf.reduce_mean(tf.square(my_output - y_target))
5.We declare our optimizer just like we did before:
my_opt = tf.train.GradientDescentOptimizer(0.02)
train_step = my_opt.minimize(loss)
6.Finally, we will loop through and iterate on the training step to optimize the algorithm. This part is different than before because we want to be able to plot the loss over versus stochastic training convergence. So we initialize a list to store the loss function every five intervals:
loss_batch = []
for i in range(100):
rand_index = np.random.choice(100, size=batch_size)
rand_x = np.transpose([x_vals[rand_index]])
rand_y = np.transpose([y_vals[rand_index]])
sess.run(train_step, feed_dict={x_data: rand_x, y_target: rand_y})
if (i+1)%5==0:
print('Step #' + str(i+1) + ' A = ' + str(sess.run(A)))
temp_loss = sess.run(loss, feed_dict={x_data: rand_x, y_ target: rand_y})
print('Loss = ' + str(temp_loss))
loss_batch.append(temp_loss)
7.Here is the final output of the 100 iterations. Notice that the value of A has an extra dimension because it now has to be a 2D matrix:
Step #100 A = [[ 9.86720943]]
Loss = 0.
How it works…
Batch training and stochastic training differ in their optimization method and their convergence. Finding a good batch size can be difficult. To see how convergence differs between batch and stochastic, here is the code to plot the batch loss from above. There is also a variable here that contains the stochastic loss, but that computation follows from the prior section in this chapter. Here is the code to save and record the stochastic loss in the training loop. Just substitute this code in the prior recipe:
loss_stochastic = []
for i in range(100):
rand_index = np.random.choice(100)
rand_x = [x_vals[rand_index]]
rand_y = [y_vals[rand_index]]
sess.run(train_step, feed_dict={x_data: rand_x, y_target: rand_y})
if (i+1)%5==0:
print('Step #' + str(i+1) + ' A = ' + str(sess.run(A)))
temp_loss = sess.run(loss, feed_dict={x_data: rand_x, y_ target: rand_y})
print('Loss = ' + str(temp_loss))
loss_stochastic.append(temp_loss)
Here is the code to produce the plot of both the stochastic and batch loss for the same regression problem:
plt.plot(range(0, 100, 5), loss_stochastic, 'b-', label='Stochastic Loss')
plt.plot(range(0, 100, 5), loss_batch, 'r--', label='Batch' Loss, size=20')
plt.legend(loc='upper right', prop={'size': 11})
plt.show()

Figure 6: Stochastic loss and batch loss (batch size = 20) plotted over 100 iterations. Note that the batch loss is much smoother and the stochastic loss is much more erratic.
There's more…

Combining Everything Together
In this section, we will combine everything we have illustrated so far and create a classifier on the iris dataset.
Getting ready
The iris data set is described in more detail in the Working with Data Sources recipe in Chapter 1, Getting Started with TensorFlow. We will load this data, and do a simple binary classifier to predict whether a flower is the species Iris setosa or not. To be clear, this dataset has three classes of species, but we will only predict whether it is a single species (I. setosa) or not, giving us a binary classifier. We will start by loading the libraries and data, then transform the target accordingly.
How to do it…
1. First we load the libraries needed and initialize the computational graph. Note that we also load matplotlib here, because we would like to plot the resulting line after:
import matplotlib.pyplot as plt
import numpy as np
from sklearn import datasets
import tensorflow as tf
sess = tf.Session()
2. Next we load the iris data. We will also need to transform the target data to be just 1 or 0 if the target is setosa or not. Since the iris data set marks setosa as a zero, we will change all targets with the value 0 to 1, and the other values all to 0. We will also only use two features, petal length and petal width. These two features are the third and fourth entry in each x-value:
iris = datasets.load_iris()
binary_target = np.array([1. if x==0 else 0. for x in iris. target])
iris_2d = np.array([[x[2], x[3]] for x in iris.data])
3. Let's declare our batch size, data placeholders, and model variables. Remember that the data placeholders for variable batch sizes have None as the first dimension:
batch_size = 20
x1_data = tf.placeholder(shape=[None, 1], dtype=tf.float32)
x2_data = tf.placeholder(shape=[None, 1], dtype=tf.float32)
y_target = tf.placeholder(shape=[None, 1], dtype=tf.float32)
A = tf.Variable(tf.random_normal(shape=[1, 1]))
b = tf.Variable(tf.random_normal(shape=[1, 1]))
4. Here we define the linear model. The model will take the form x2=x1*A+b. And if we want to find points above or below that line, we see whether they are above or below zero when plugged into the equation x2-x1*A-b. We will do this by taking the sigmoid of that equation and predicting 1 or 0 from that equation. Remember that TensorFlow has loss functions with the sigmoid built in, so we just need to define the output of the model prior to the sigmoid function:
my_mult = tf.matmul(x2_data, A)
my_add = tf.add(my_mult, b)
my_output = tf.sub(x1_data, my_add)
5. Now we add our sigmoid cross-entropy loss function with TensorFlow's built in function, sigmoid_cross_entropy_with_logits():
xentropy = tf.nn.sigmoid_cross_entropy_with_logits(my_output, y_ target)
6. We also have to tell TensorFlow how to optimize our computational graph by declaring an optimizing method. We will want to minimize the cross-entropy loss. We will also choose 0.05 as our learning rate:
my_opt = tf.train.GradientDescentOptimizer(0.05)
train_step = my_opt.minimize(xentropy)
7. Now we create a variable initialization operation and tell TensorFlow to execute it:
init = tf.initialize_all_variables()
sess.run(init)
8. Now we will train our linear model with 1000 iterations. We will feed in the three data points that we require: petal length, petal width, and the target variable. Every 200 iterations we will print the variable values:
for i in range(1000):
rand_index = np.random.choice(len(iris_2d), size=batch_size)
rand_x = iris_2d[rand_index]
rand_x1 = np.array([[x[0]] for x in rand_x])
rand_x2 = np.array([[x[1]] for x in rand_x])
rand_y = np.array([[y] for y in binary_target[rand_index]])
sess.run(train_step, feed_dict={x1_data: rand_x1, x2_data: rand_x2, y_target: rand_y})
if (i+1)%200==0:
print('Step #' + str(i+1) + ' A = ' + str(sess.run(A)) + ', b = ' + str(sess.run(b)))
Step #200 A = [[ 8.67285347]], b = [[-3.47147632]]
Step #400 A = [[ 10.25393486]], b = [[-4.62928772]]
Step #600 A = [[ 11.152668]], b = [[-5.4077611]]
Step #800 A = [[ 11.81016064]], b = [[-5.96689034]]
Step #1000 A = [[ 12.41202831]], b = [[-6.34769201]]
9. The next set of commands extracts the model variables, and plots the line on a graph. The resulting graph is in the next section:
[[slope]] = sess.run(A)
[[intercept]] = sess.run(b)
x = np.linspace(0, 3, num=50)
ablineValues = []
for i in x:
ablineValues.append(slope*i+intercept)
setosa_x = [a[1] for i,a in enumerate(iris_2d) if binary_ target==1]
setosa_y = [a[0] for i,a in enumerate(iris_2d) if binary_ target==1]
non_setosa_x = [a[1] for i,a in enumerate(iris_2d) if binary_ target==0]
non_setosa_y = [a[0] for i,a in enumerate(iris_2d) if binary_ target==0]
plt.plot(setosa_x, setosa_y, 'rx', ms=10, mew=2, label='setosa''')
plt.plot(non_setosa_x, non_setosa_y, 'ro', label='Non-setosa')
plt.plot(x, ablineValues, 'b-')
plt.xlim([0.0, 2.7])
plt.ylim([0.0, 7.1])
plt.suptitle('Linear' Separator For I.setosa', fontsize=20)
plt.xlabel('Petal Length')
plt.ylabel('Petal Width')
plt.legend(loc='lower right')
plt.show()
How it works…
Our goal was to fit a line between the I.setosa points and the other two species using only petal width and petal length. If we plot the points and the resulting line, we see that we have achieved the following:

Figure 7: Plot of I.setosa and non-setosa for petal width vs petal length. The solid line is the linear separator that we achieved after 1,000 iterations.
There's more…
While we achieved our objective of separating the two classes with a line, it may not be the best model for separating two classes. In Chapter 4, Support Vector Machines we will discuss support vector machines, which is a better way of separating two classes in a feature space.
See also
For more information on the iris dataset, see the Wikipedia entry, https://en.wikipedia. org/wiki/Iris_flower_data_set. For information about the Scikit Learn iris dataset implementation, see the documentation at http://scikit-learn.org/stable/auto_ examples/datasets/plot_iris_dataset.html. |
 /2
/2 